

📊Pristine Volume Analysis Guide
Everything you need to know about the Pristine volume analysis methodology


Introduction
Pristine Volume Analysis is a powerful indicator designed for traders seeking clear, actionable insights from volume data. By automatically detecting and flagging key conditions such as high volume run rate, highest volume ever (HVE), highest volume in a year (HVY), and high float rotation, this tool helps users quickly assess when a stock is experiencing meaningful shifts in activity. Its customizable settings allow traders to tailor alerts and thresholds, reducing noise and focusing on the most important metrics for their trading style.
Beyond just raw volume, Pristine Volume Analysis integrates liquidity and share structure data, enabling users to confirm breakouts, gauge market sentiment, and screen for optimal trading opportunities across watchlists. Whether you're looking to capitalize on emerging trends or avoid the volatility of meme stocks, this indicator streamlines the process and delivers clear volume signals to inform your trading decisions.
The content for the following educational article was pulled directly from the documentation for our Pristine Volume Analysis TradingView indicator, which is completely FREE to use ⚙️
Without further ado. Let’s dive in!
Table of Contents
▪ Organize Volume, Liquidity, and Share Structure
▪ Settings and Preferences
▪ Custom Alerts on HVE and HVY
▪ Screen for HVE or HVY
▪ Volume Analysis Use Case : Confirming a breakout
▪ Volume Analysis Use Case : Gauging sentiment
▪ Volume Analysis Use Case : Passing on a meme stock
Organize Volume, Liquidity, and Share Structure
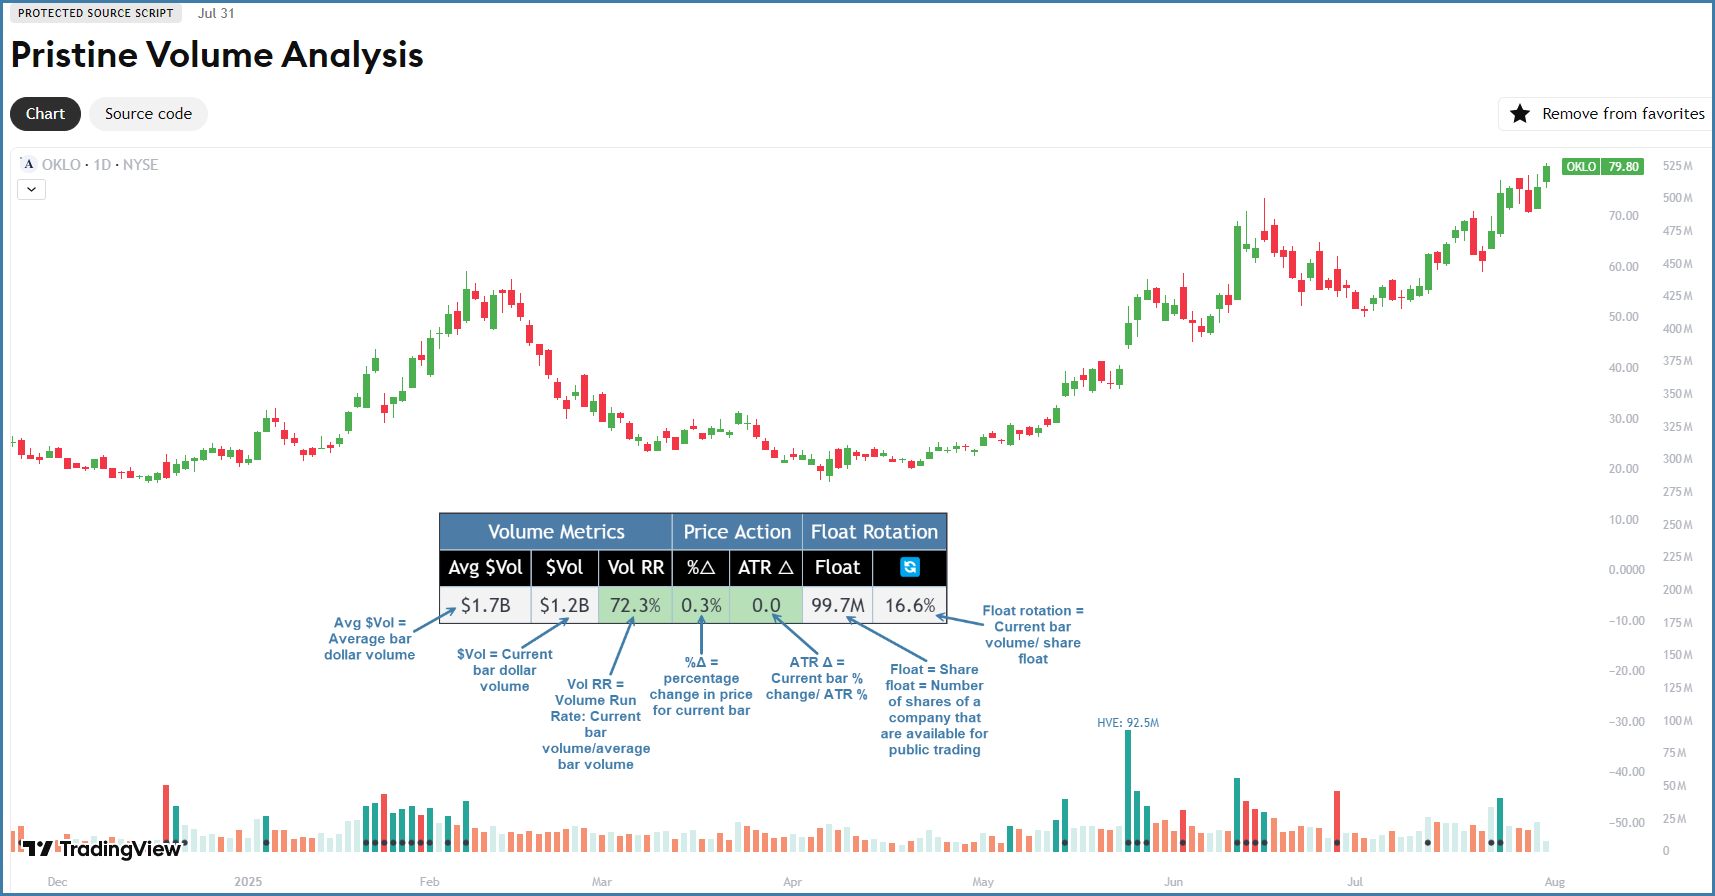
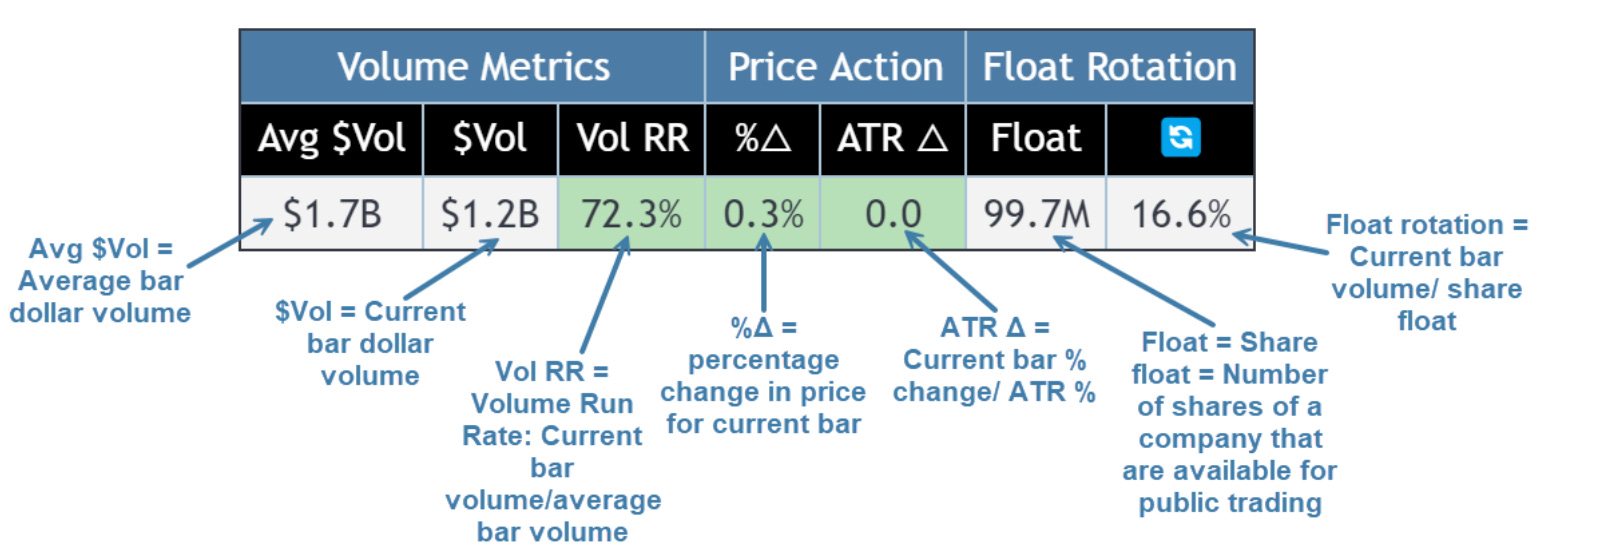
The Pristine Volume Analysis indicator organizes volume, liquidity, and share structure data, allowing users to quickly gauge the relative volume a security is trading on, and whether it is liquid enough to trade🏆
Volume is an important metric to track when trading, because abnormally high volume tends to occur when a new trend is kicking off, or when an established trend is hitting a climax.
Track only the most important metrics, reducing mental clutter and noise:
▪ Volume run rate - Candle volume/ Avg candle volume
▪ Security liquidity - Average volume and average dollar volume
▪ Float rotation - Candle volume/ Float
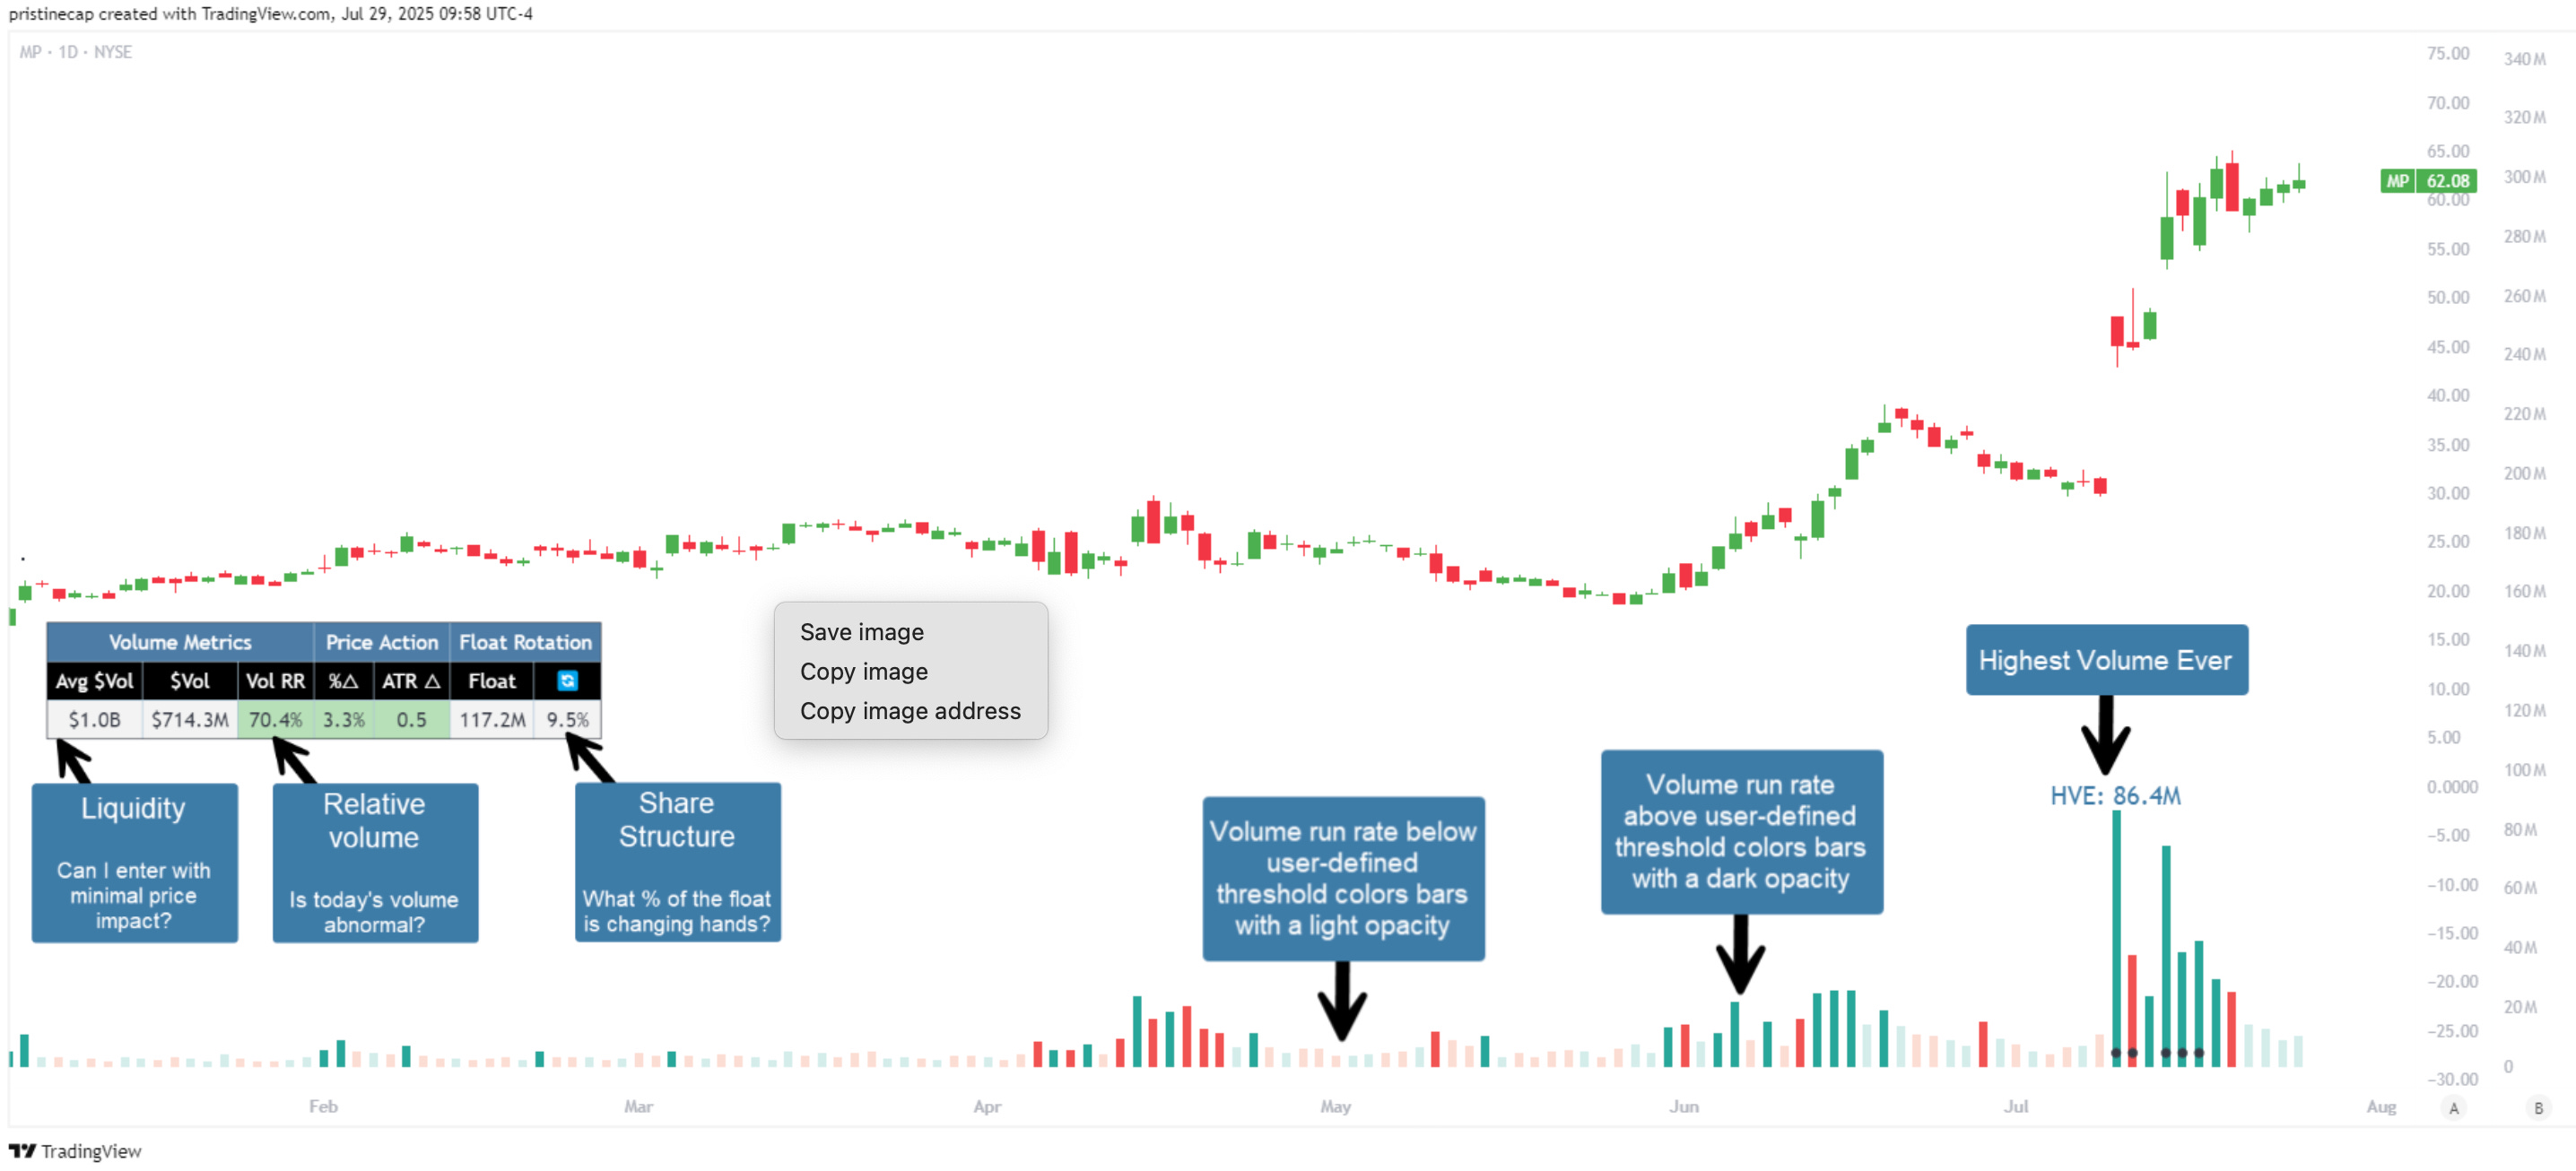
This script automatically detects and flags the following conditions on volume bars:
▪ High volume run rate buying/selling based on user-defined thresholds
▪ HVE (highest volume ever) & HVY (highest volume in a year)
▪ High float rotation based on user-defined thresholds
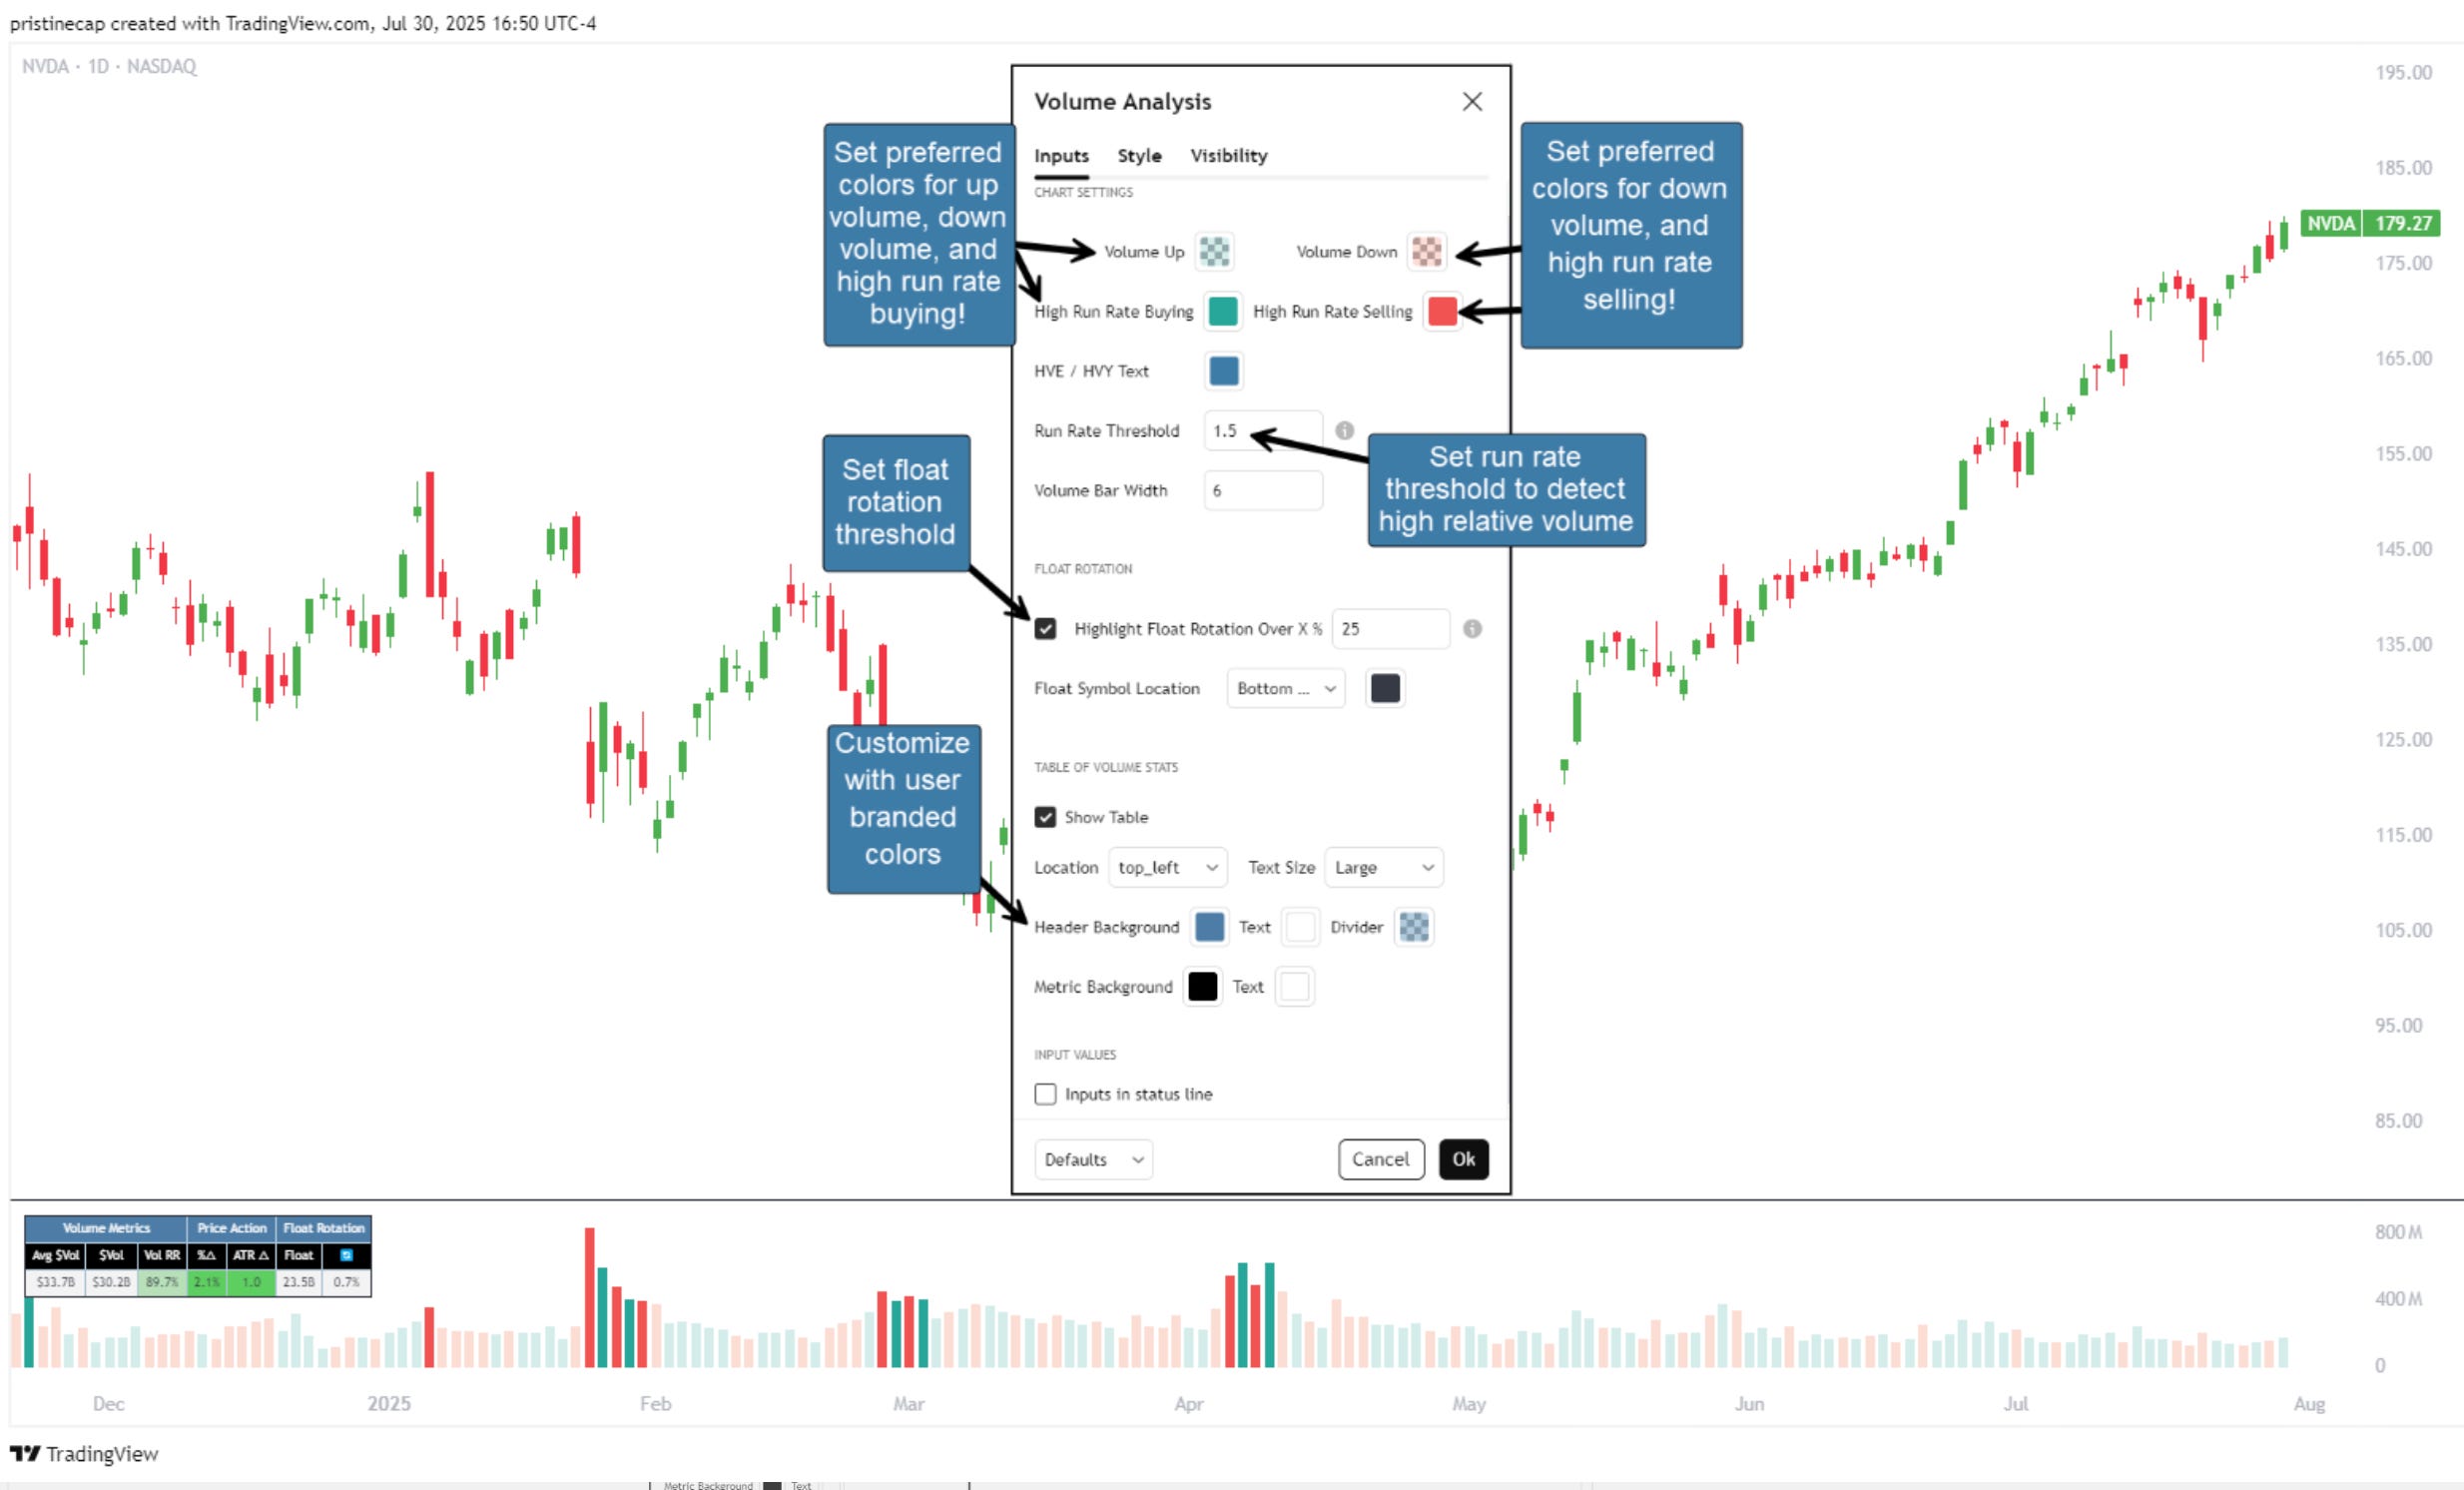
Settings and Preferences
Customize this script based by setting preferred colors and thresholds:
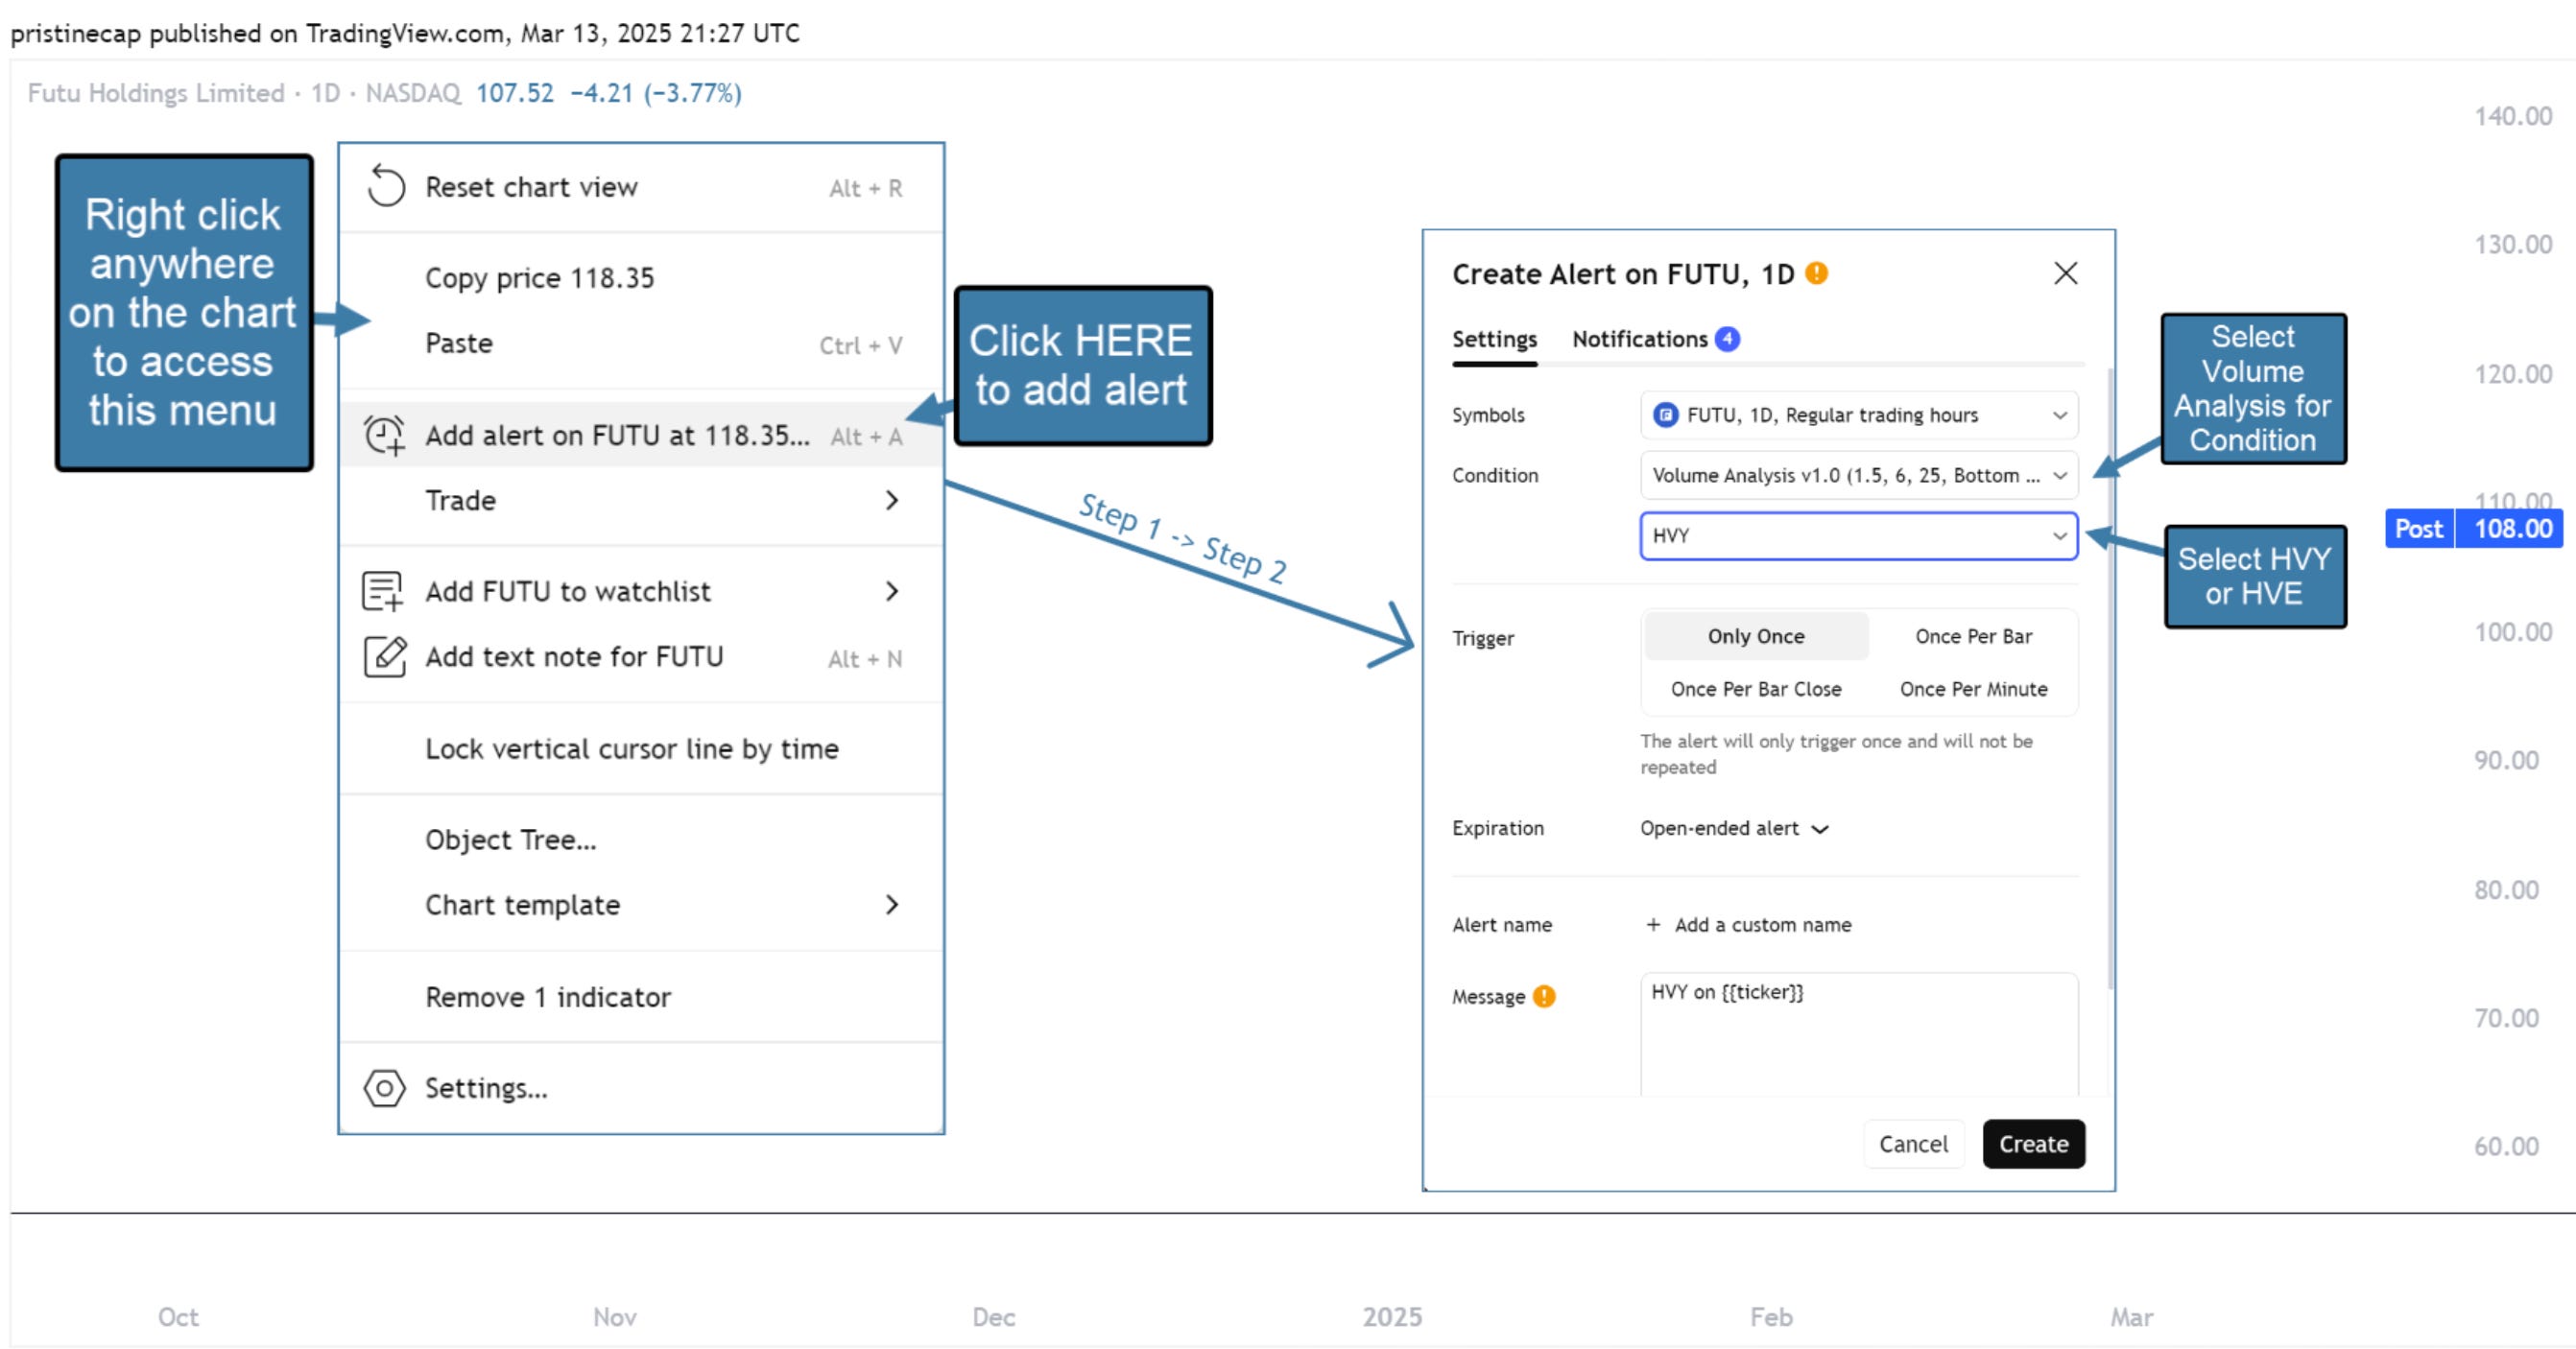
Custom Alerts on HVE and HVY
Set custom alerts on a single equity or an entire watchlist to receive notifications when volume hits HVE or HVY.
Screen for HVE or HVY
Using the Pine Screener, scan watchlists for equities that have reached HVE or HVY.
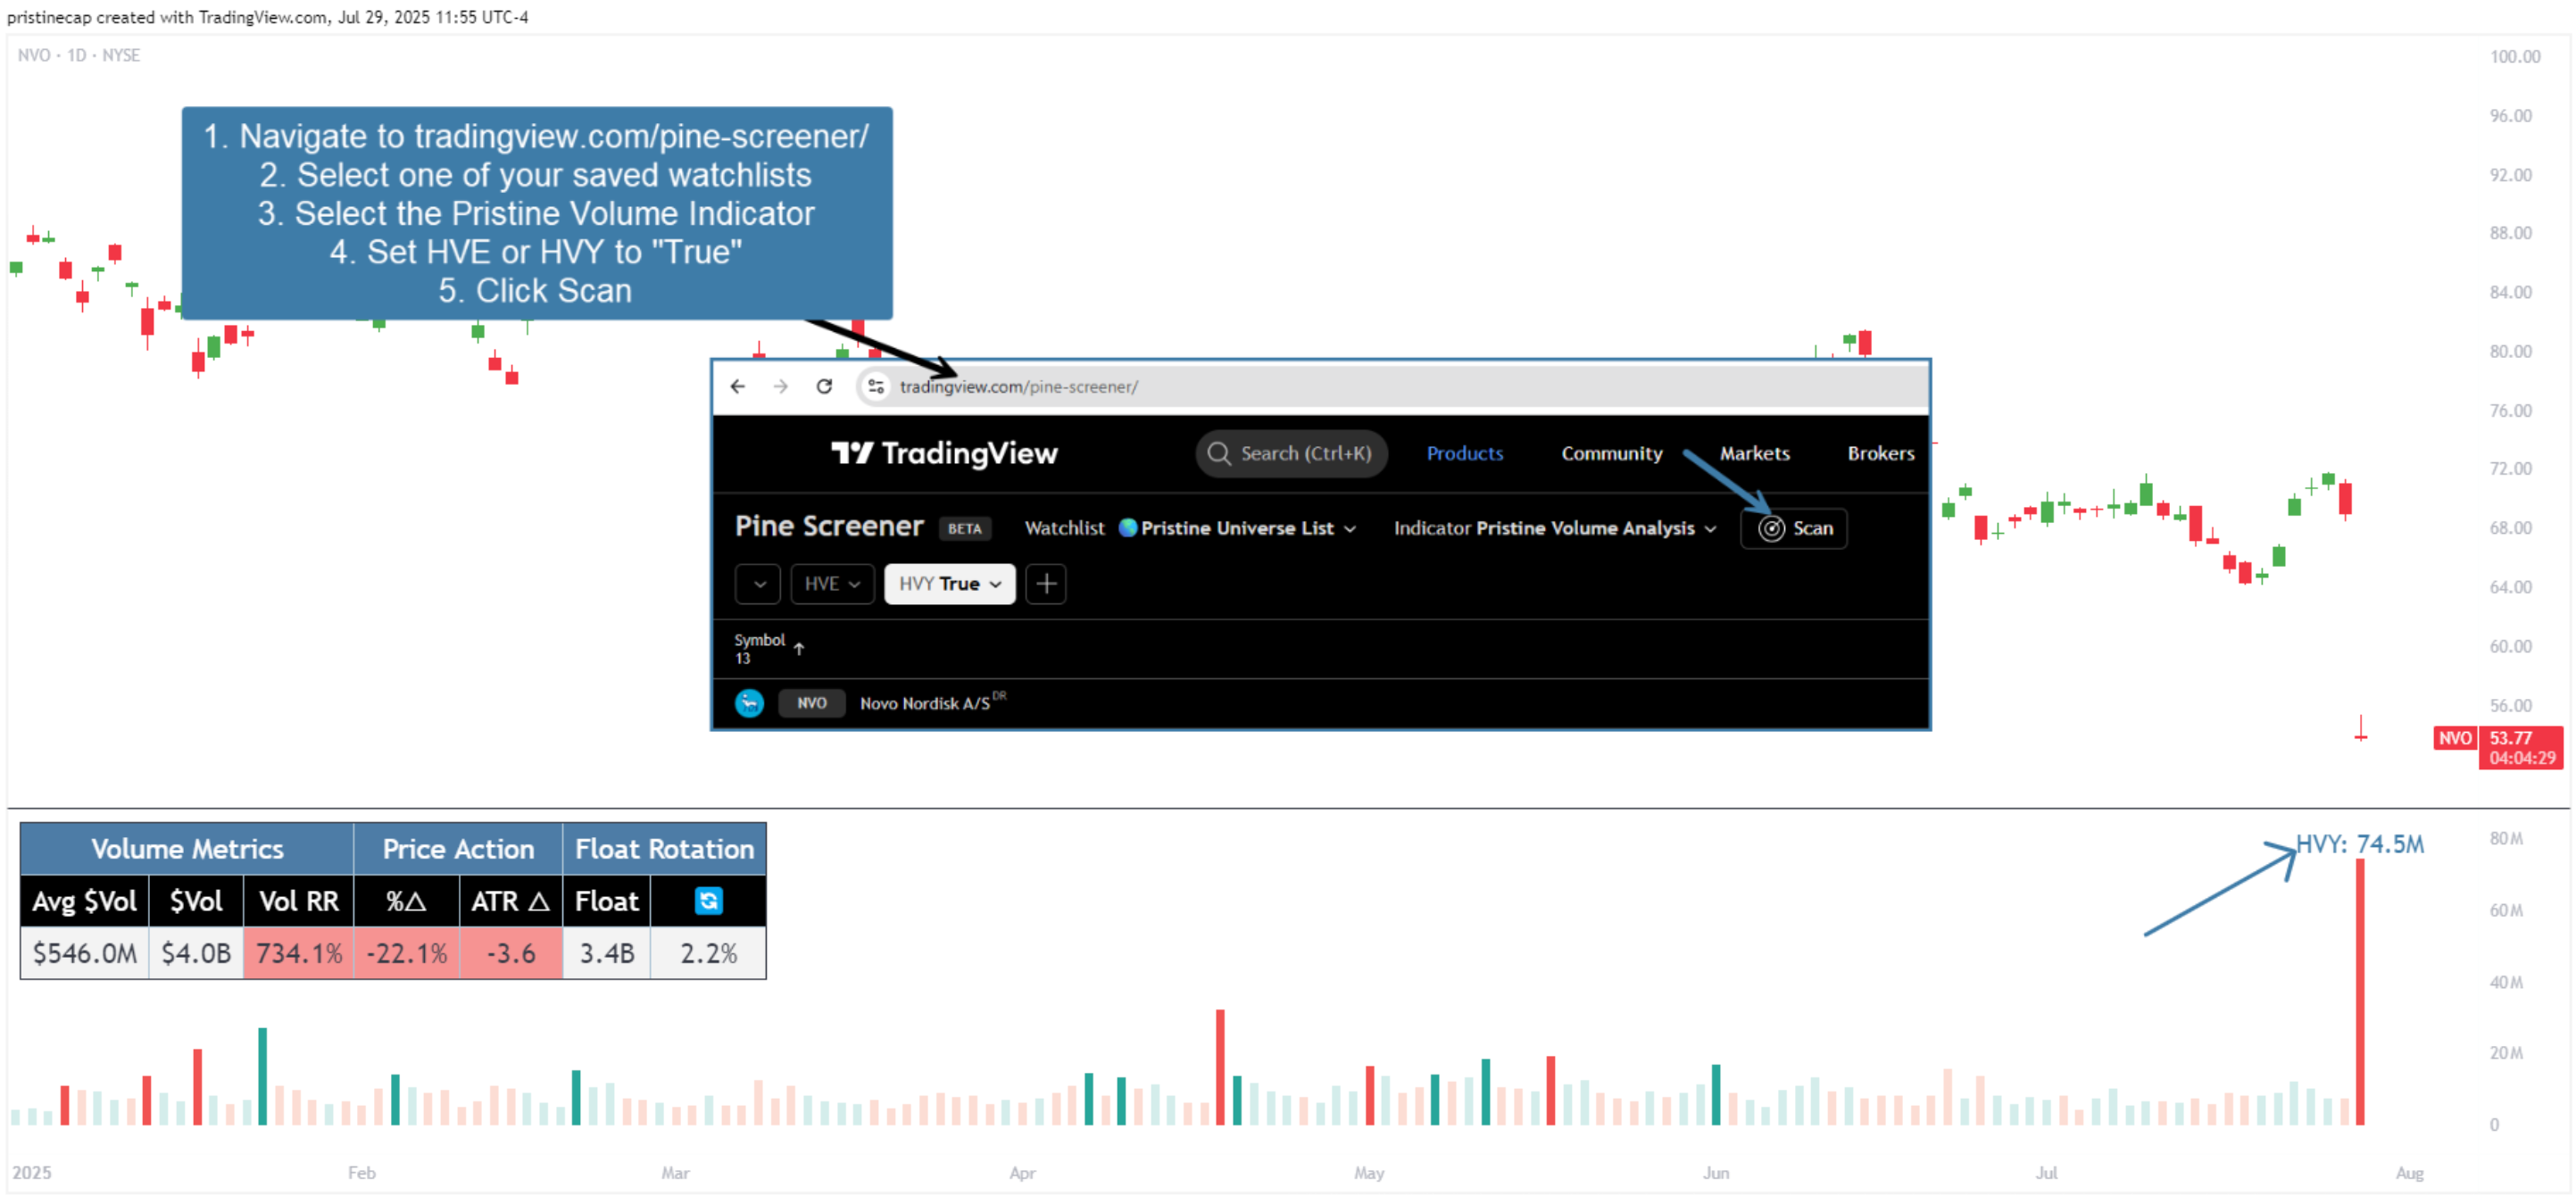
Note: The Pine Screener is limited to calculations on the last 500 bars. If a symbol has less than 500 bars and has reached HVE, it will be included in the screener results. All symbols with more than 500 historical bars will not be included in the scan.
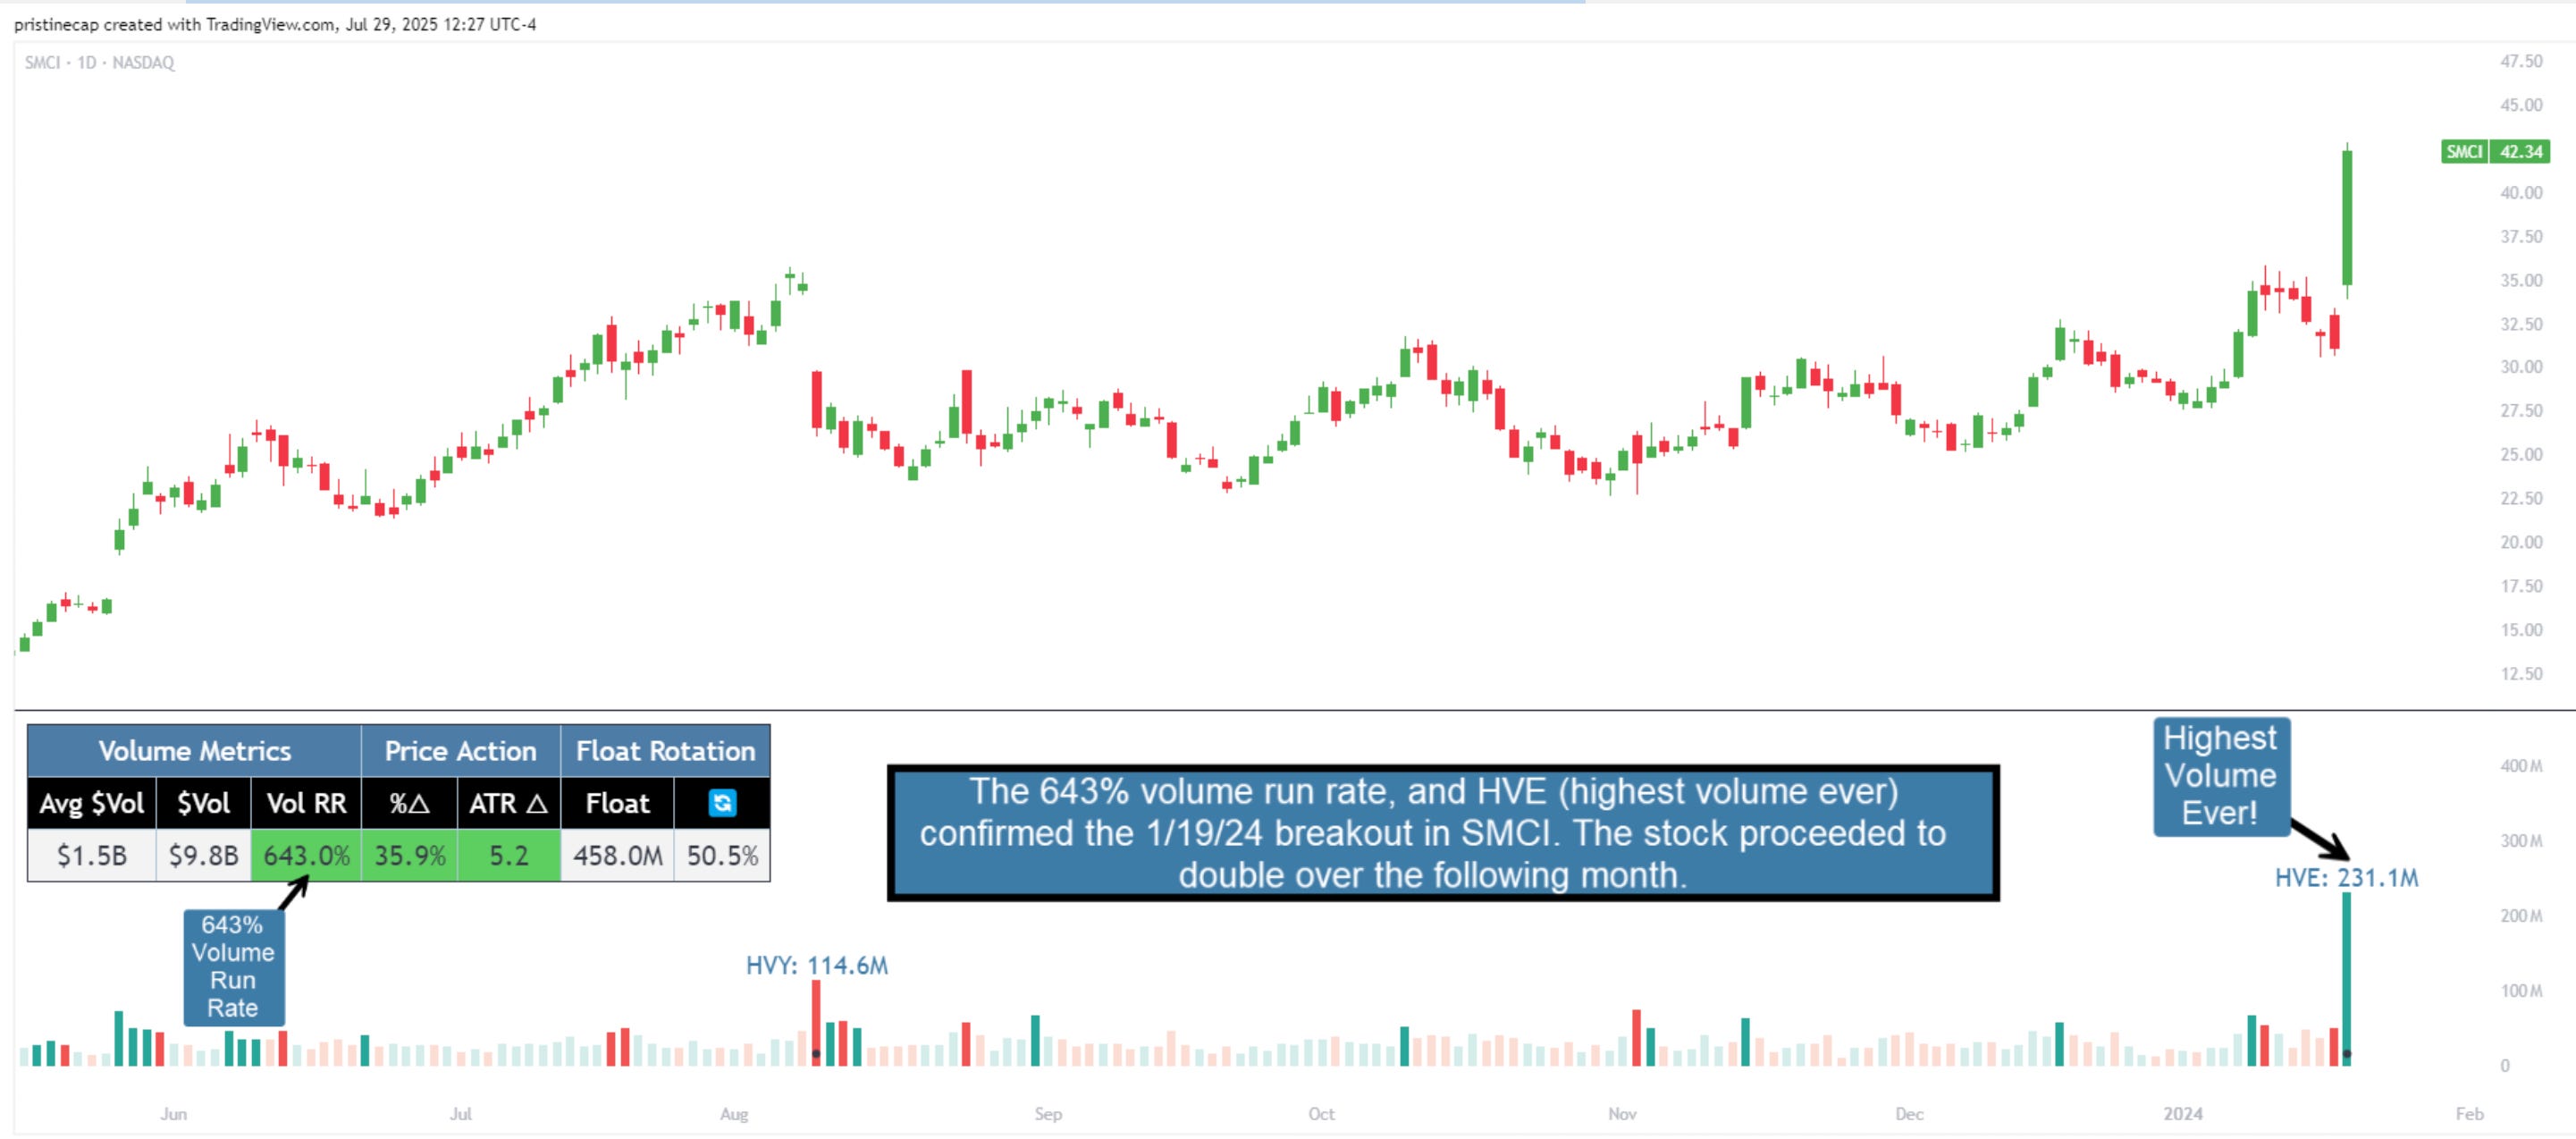
Volume Analysis Use Case : Confirming a breakout (1/3)
A high volume run rate as a stock breaks out to new highs can confirm a change of character and increase the odds of success on long setups. SMCI put in an HVE candle in January '24, sparking a super-performance run.
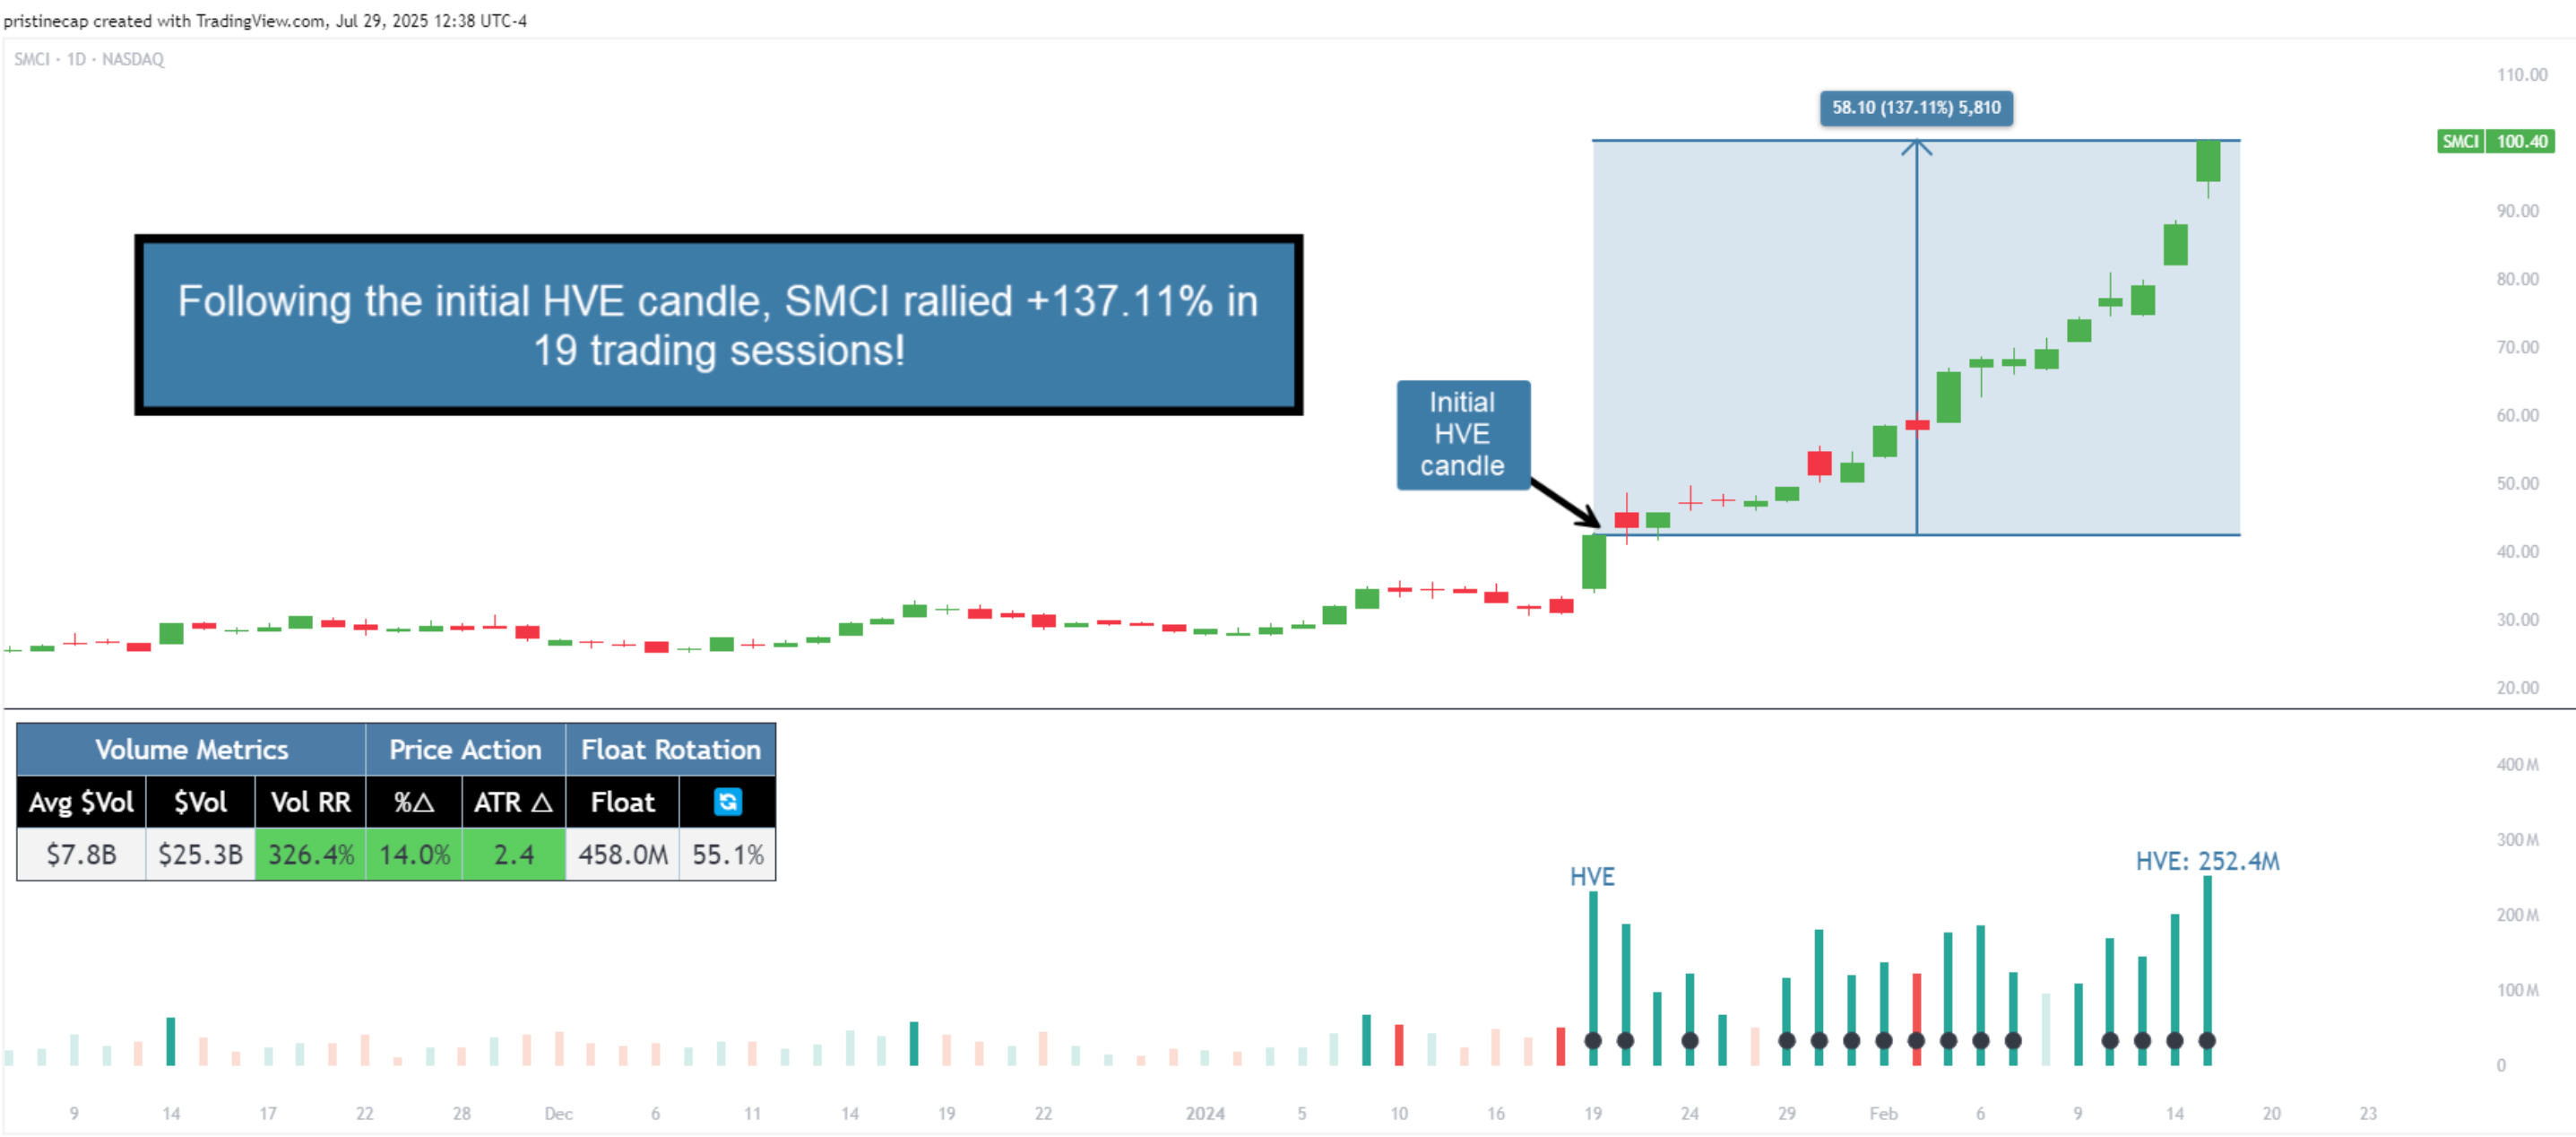
1-Month follow-through +137%
SMCI had plenty of gas left in the tank after putting in it's first HVE candle. The rest is history!
Volume Analysis Use Case : Gauging sentiment (2/3)
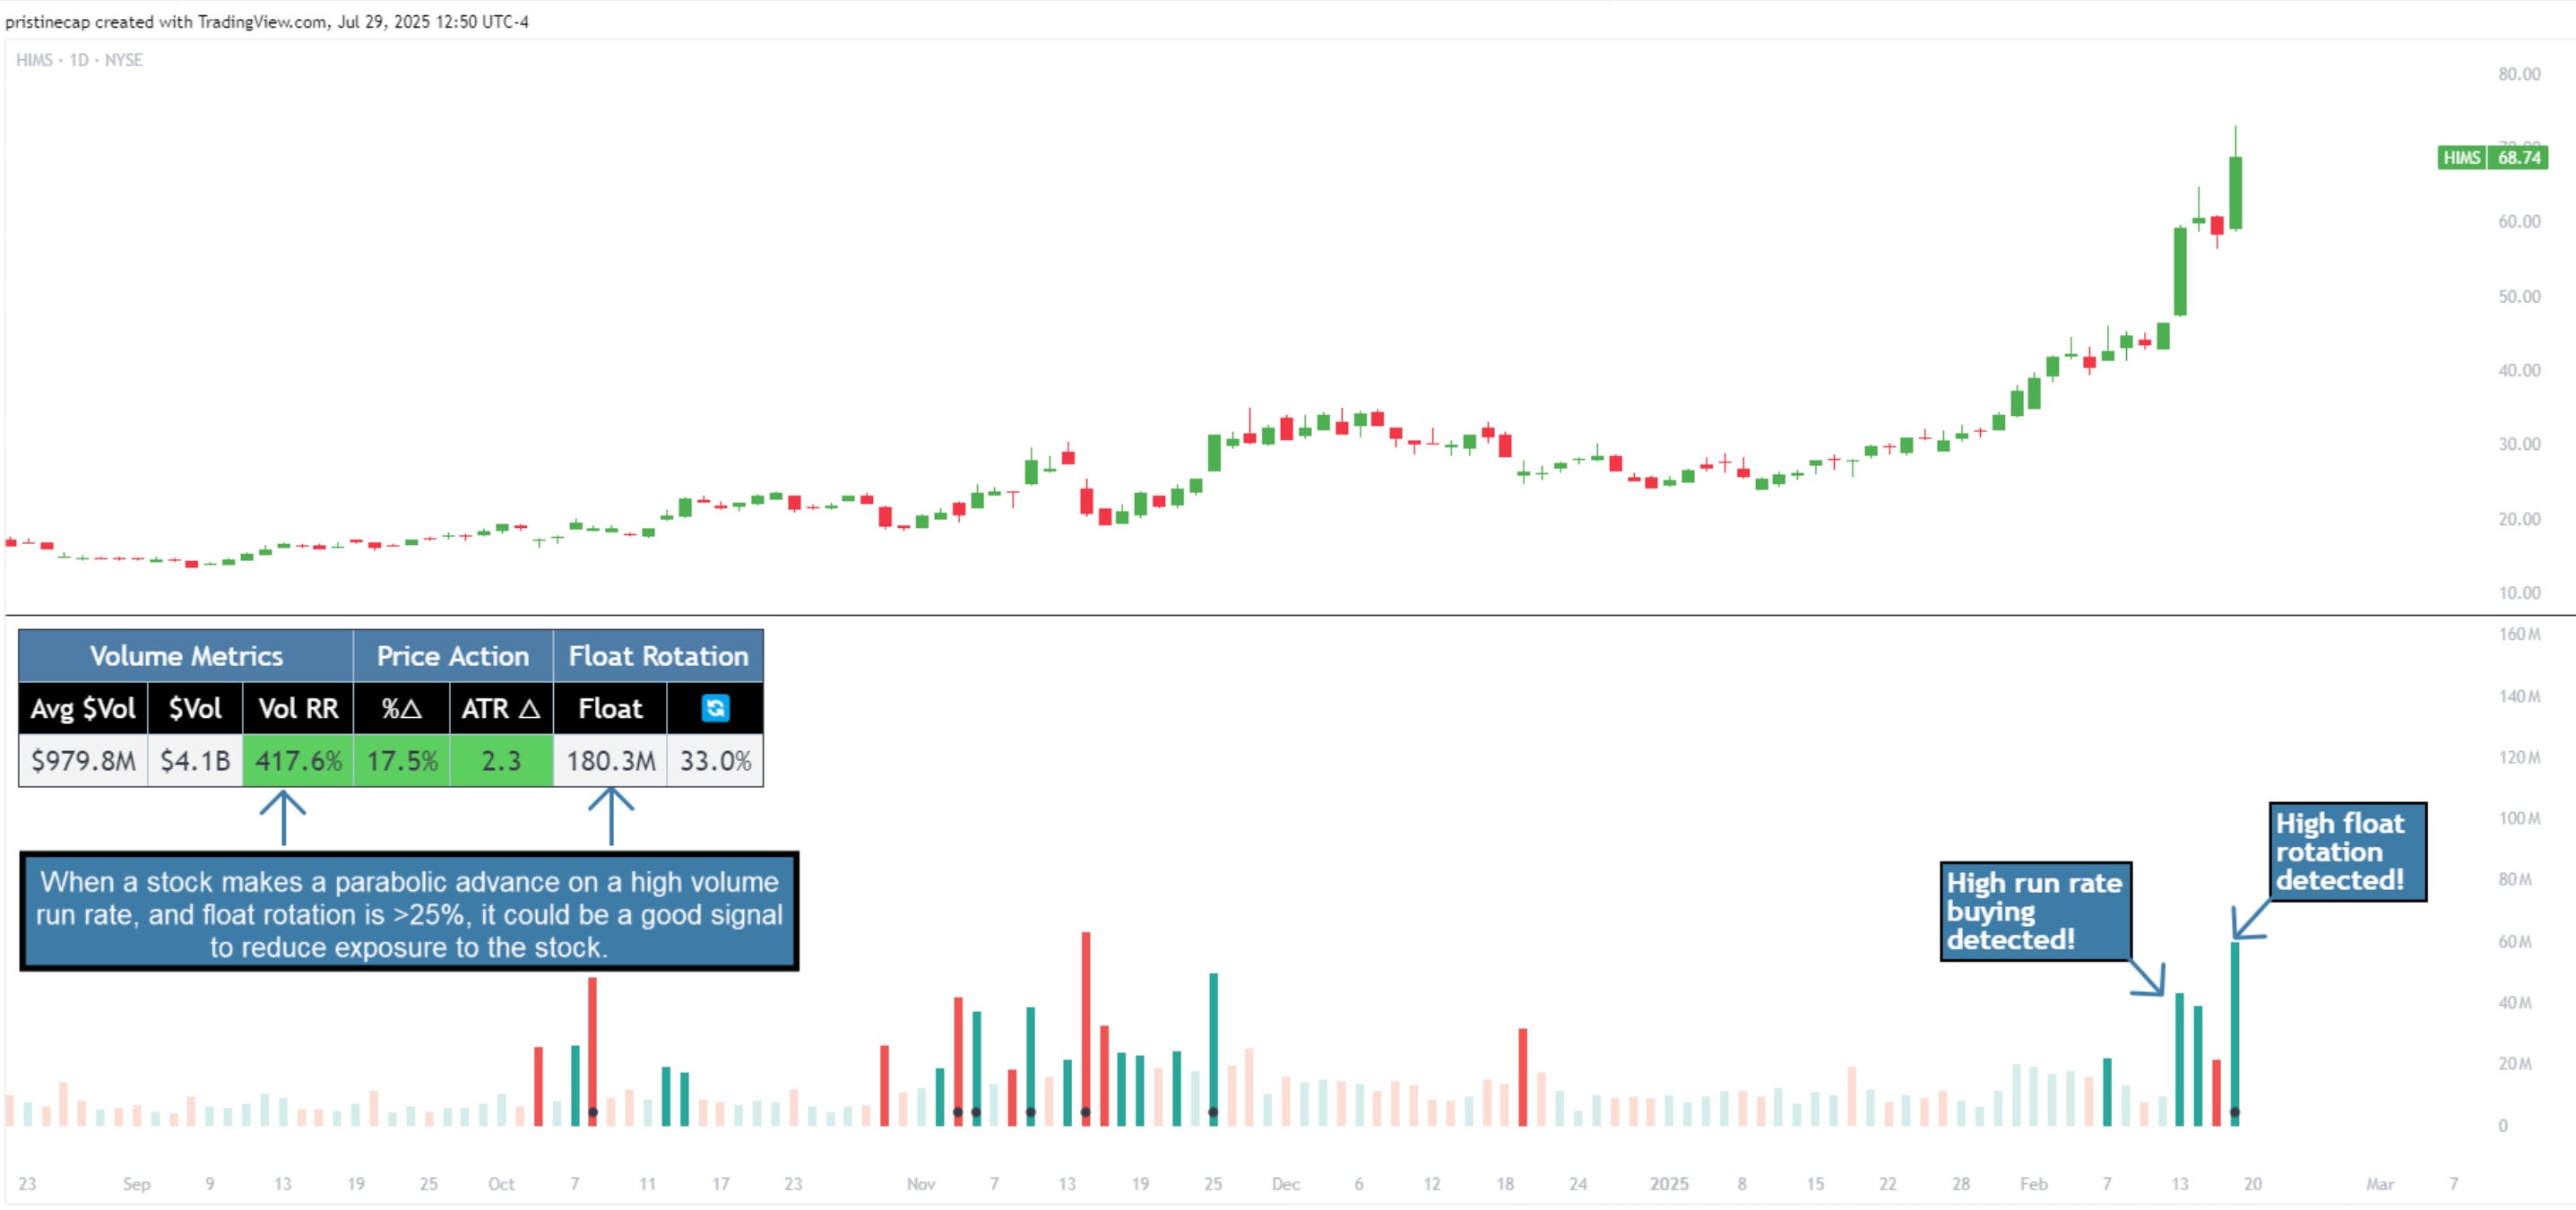
When a stock advances on repeated high run rate volume and an increasing angle of ascent (parabolic), it can be a good indication that sentiment is overheated and it is time to reduce exposure to the stock.
Note:25% is the default float rotation threshold. This value can be customized based on your own trading style and preferences.
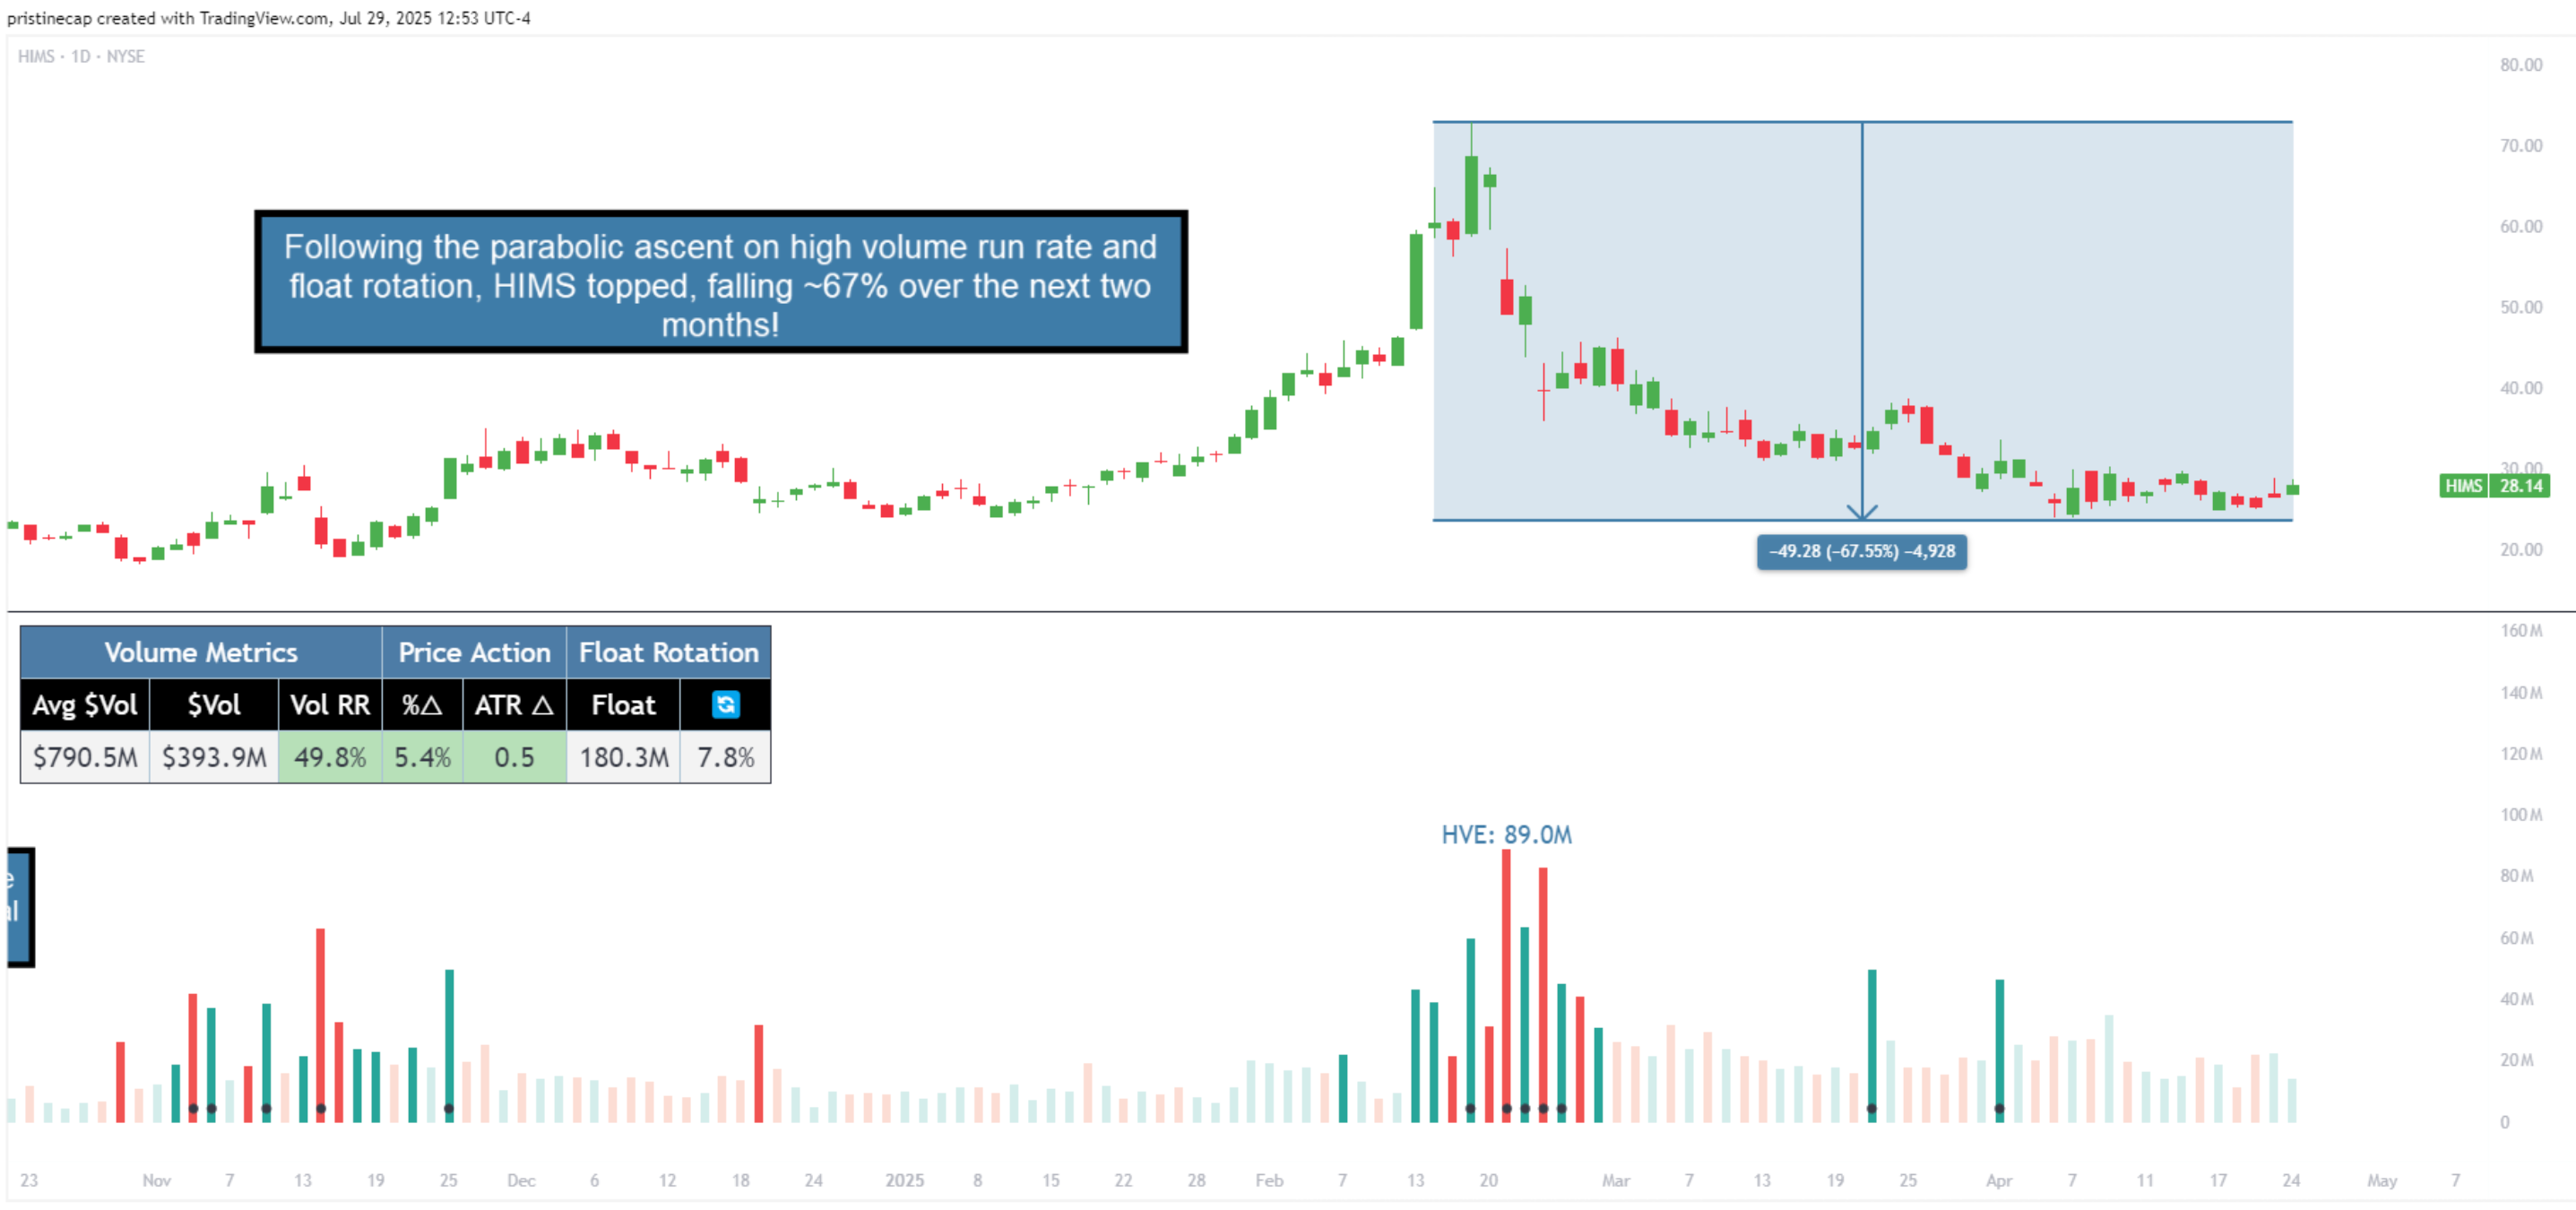
Following the parabolic ascent on high volume run rate and float rotation, HIMS topped, falling ~67% over the next two months!
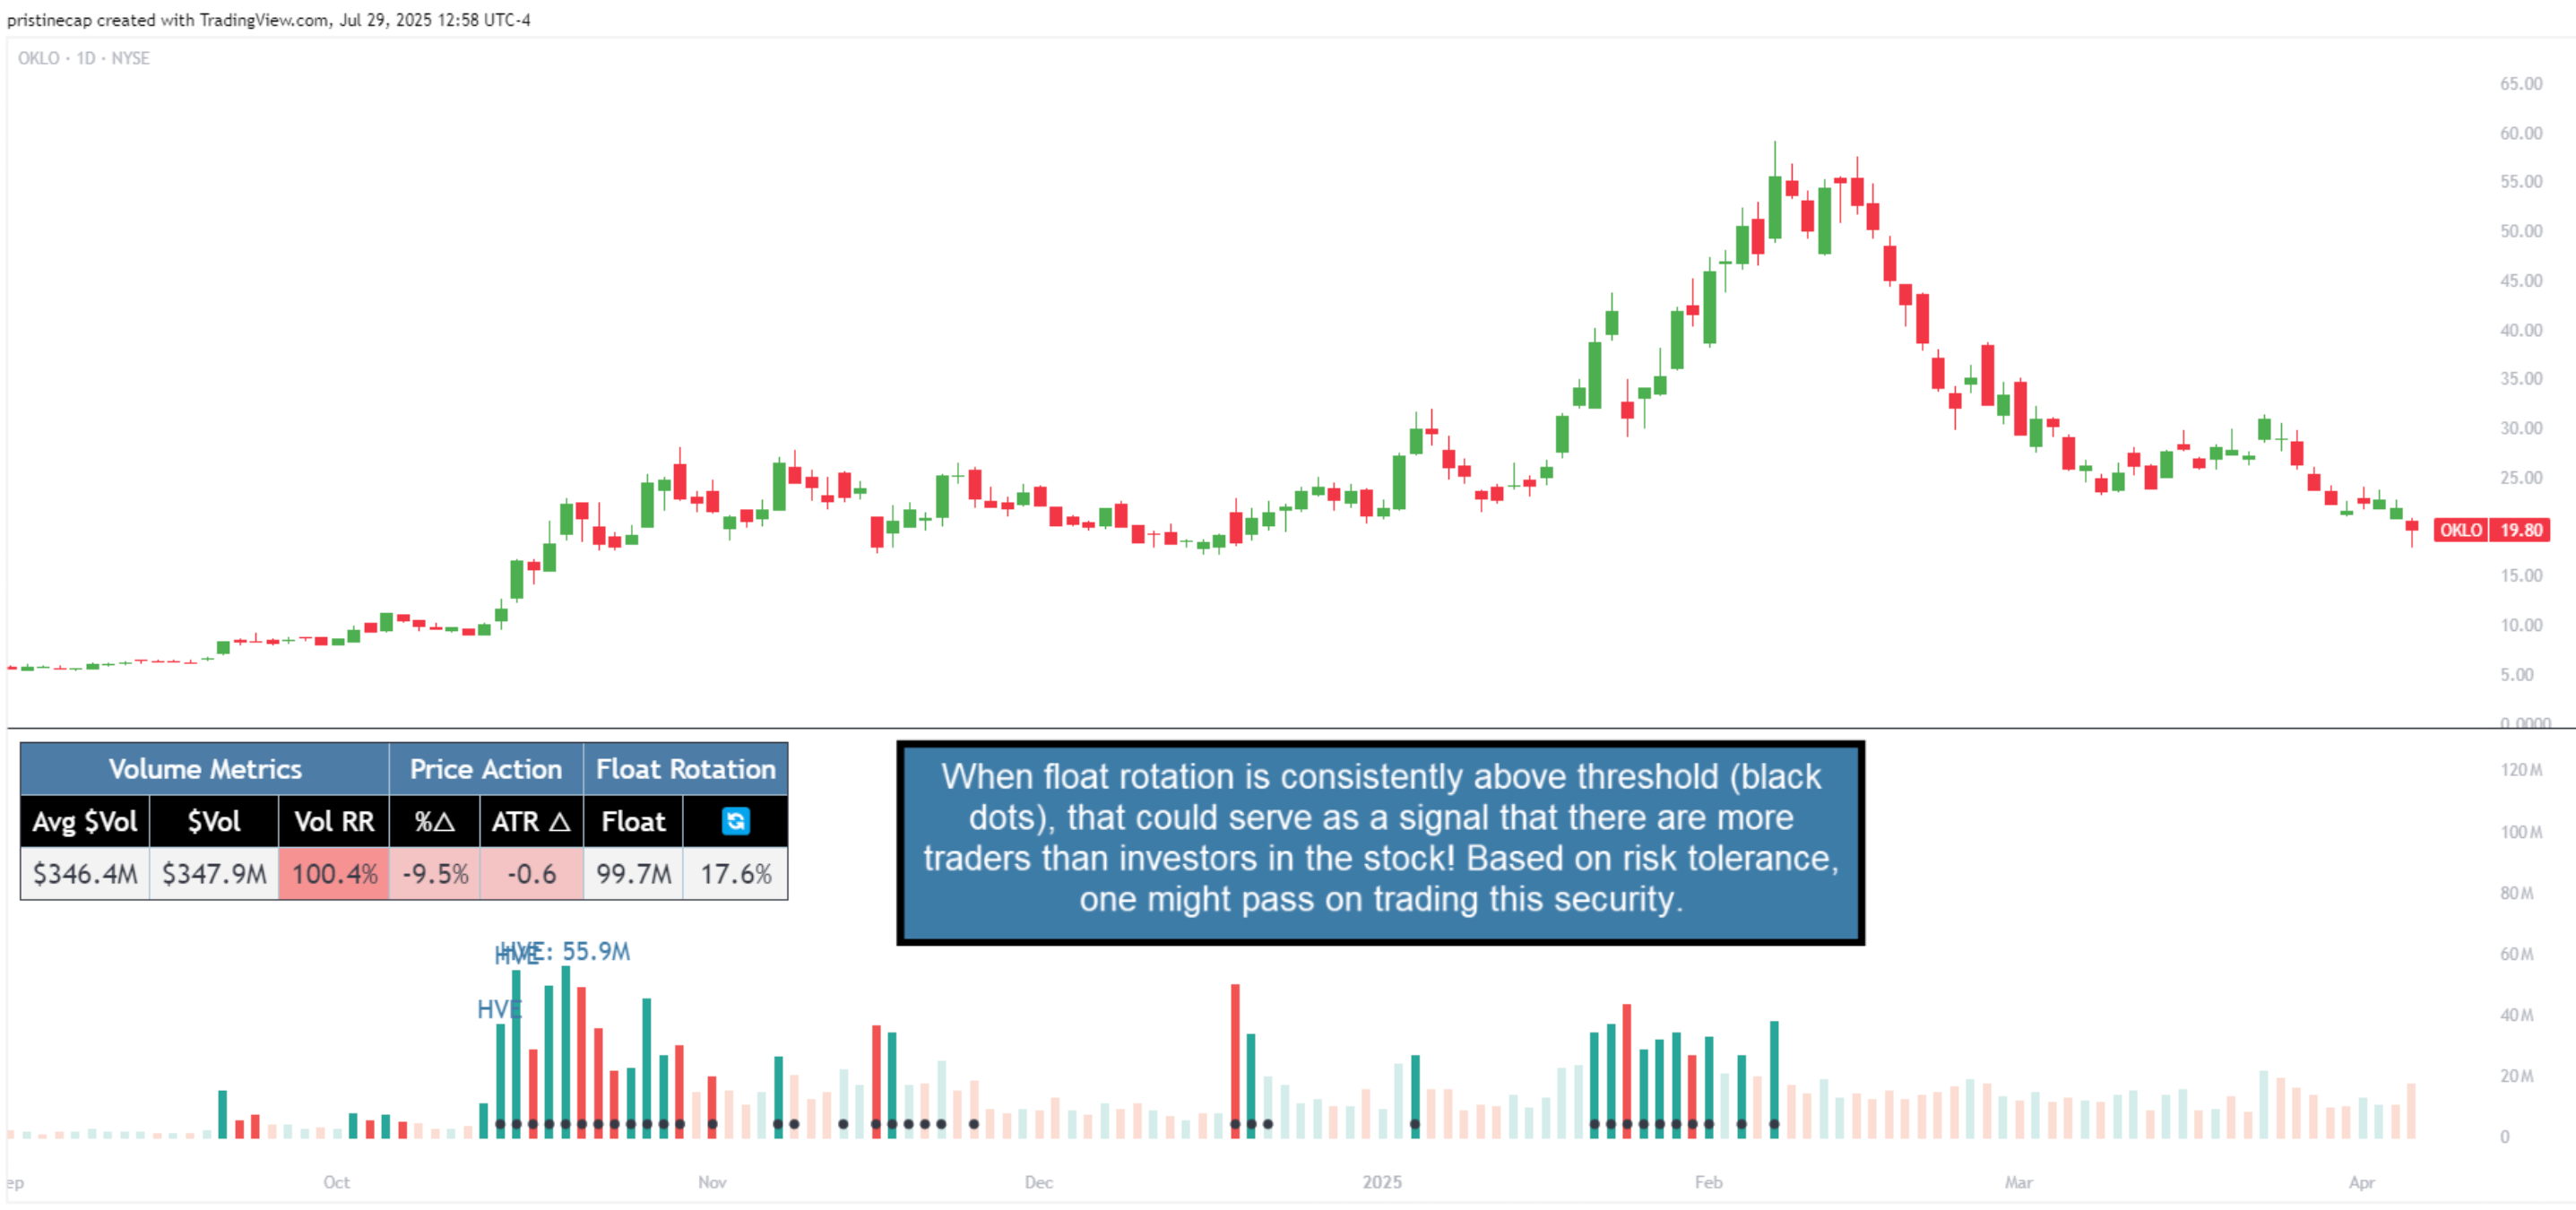
Volume Analysis Use Case : Passing on a meme stock (3/3)
High float rotation often goes hand-in-hand with high stock volatility. One might opt out of trading a stock if it is outside their risk tolerance.
Thank you for making this indicator free. I will definitely check this out. I really like volume.