

🏆The Complete TradingView Toolkit: Free & Premium
The Official Directory of Pristine Capital Indicators


📊The Pristine Capital Indicator Suite
My goal is simple: build the best technological infrastructure for navigating financial markets.
I designed these indicators to automate the heavy lifting, helping us spot regime changes, identify asymmetric risk/reward setups, and plan trades with precision. This is the decision support system I use to compete in the US Investing Championship.
This page serves as the central hub for that infrastructure. 🏘️
Whether you are looking for free tools to enhance your charts or want to upgrade your workflow with my paid institutional-grade scripts, you will find everything listed below.
🔓The Free Indicator Library
Professional-grade tools available to the public at no cost
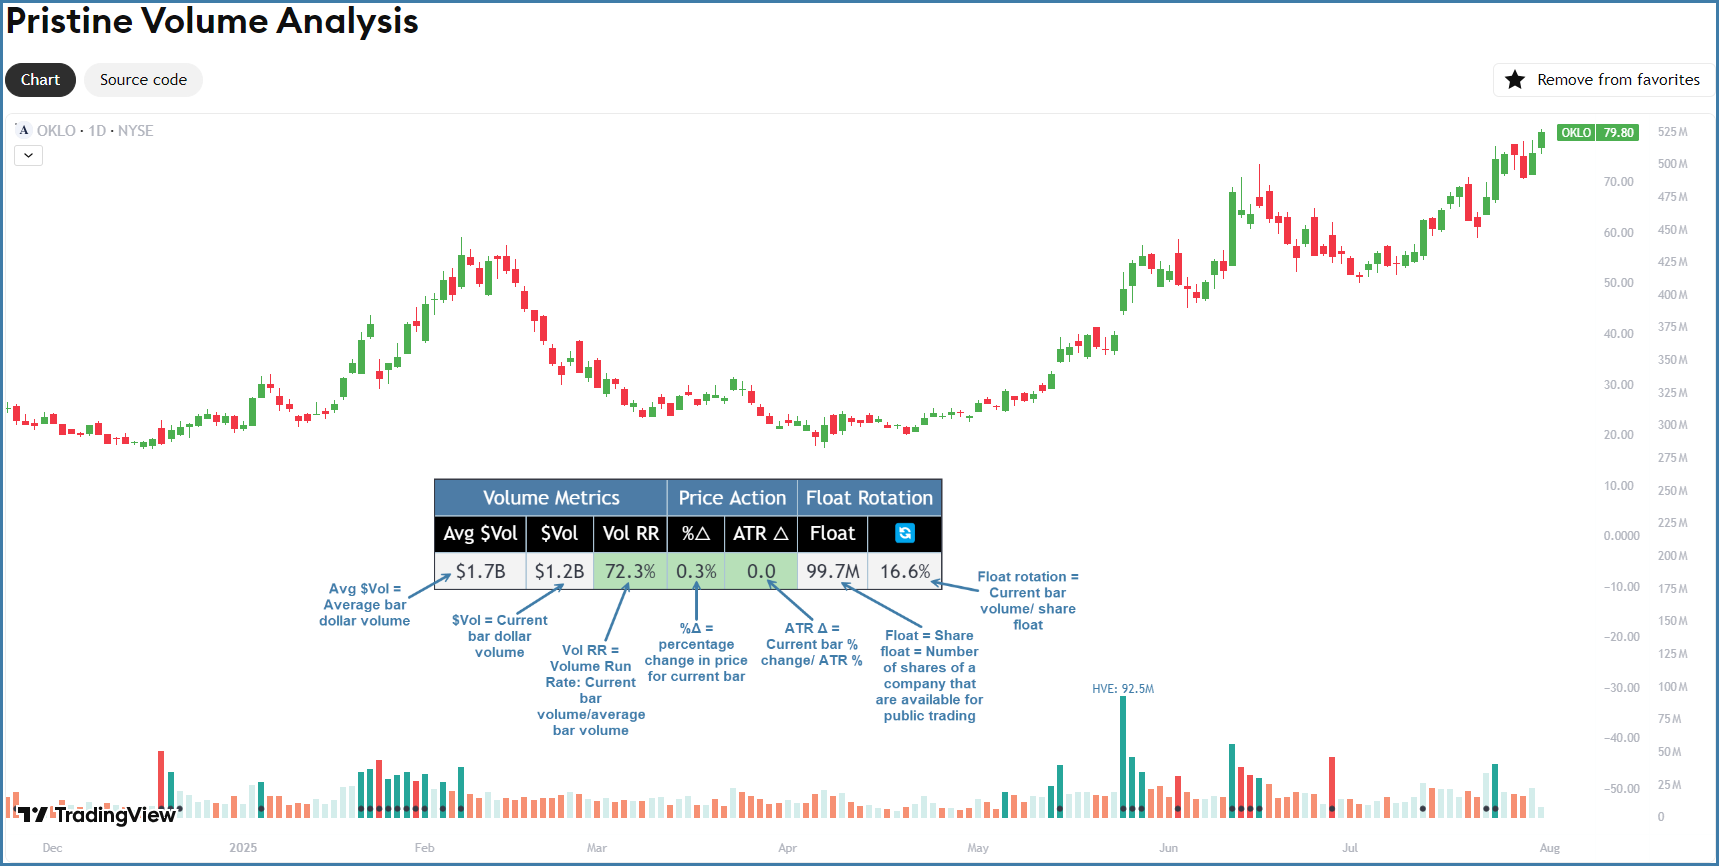
Volume is the fuel for every major move. This tool organizes liquidity and share structure data, allowing you to instantly spot institutional footprints.
Key Features: Automatically flags “Highest Volume Ever” (HVE), calculates daily volume run rates, and detects float rotation anomalies in real-time.
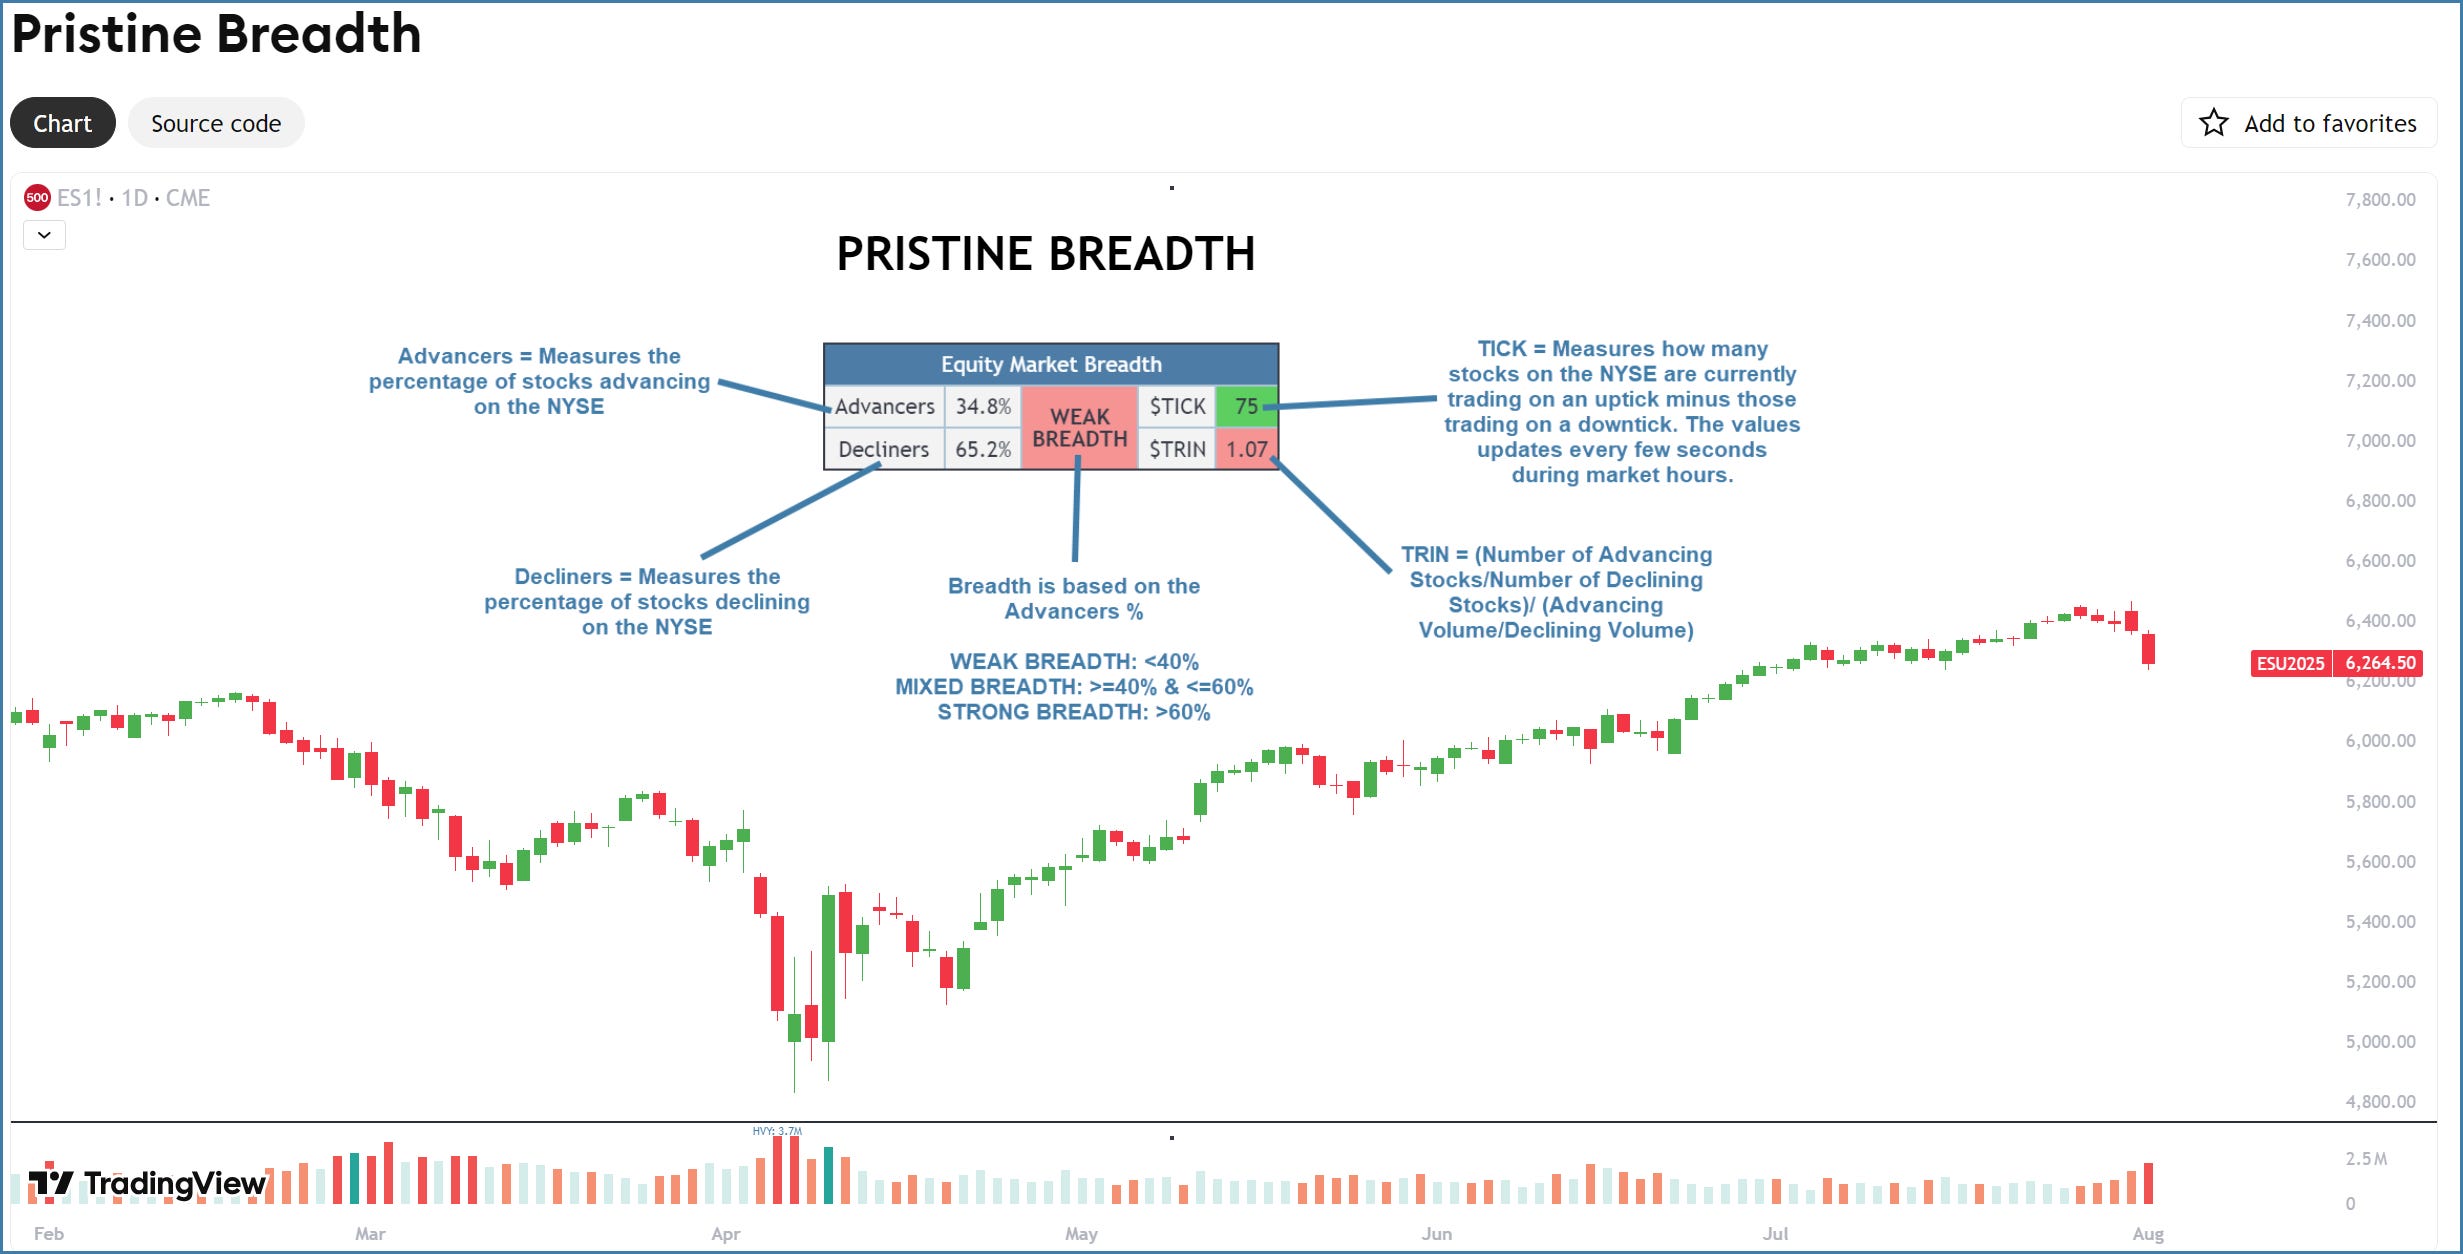
Stop guessing the market’s true health. This indicator visualizes the raw flow of money by monitoring the relationship between advancing and declining stocks, alongside critical sentiment gauges like $TICK and $TRIN.
Why it matters: It reveals the truth behind the price action. Whether you are seeing a “hollow” rally on low participation or a genuine accumulation day, this tool gives you the conviction to press your winners or sit on your hands.
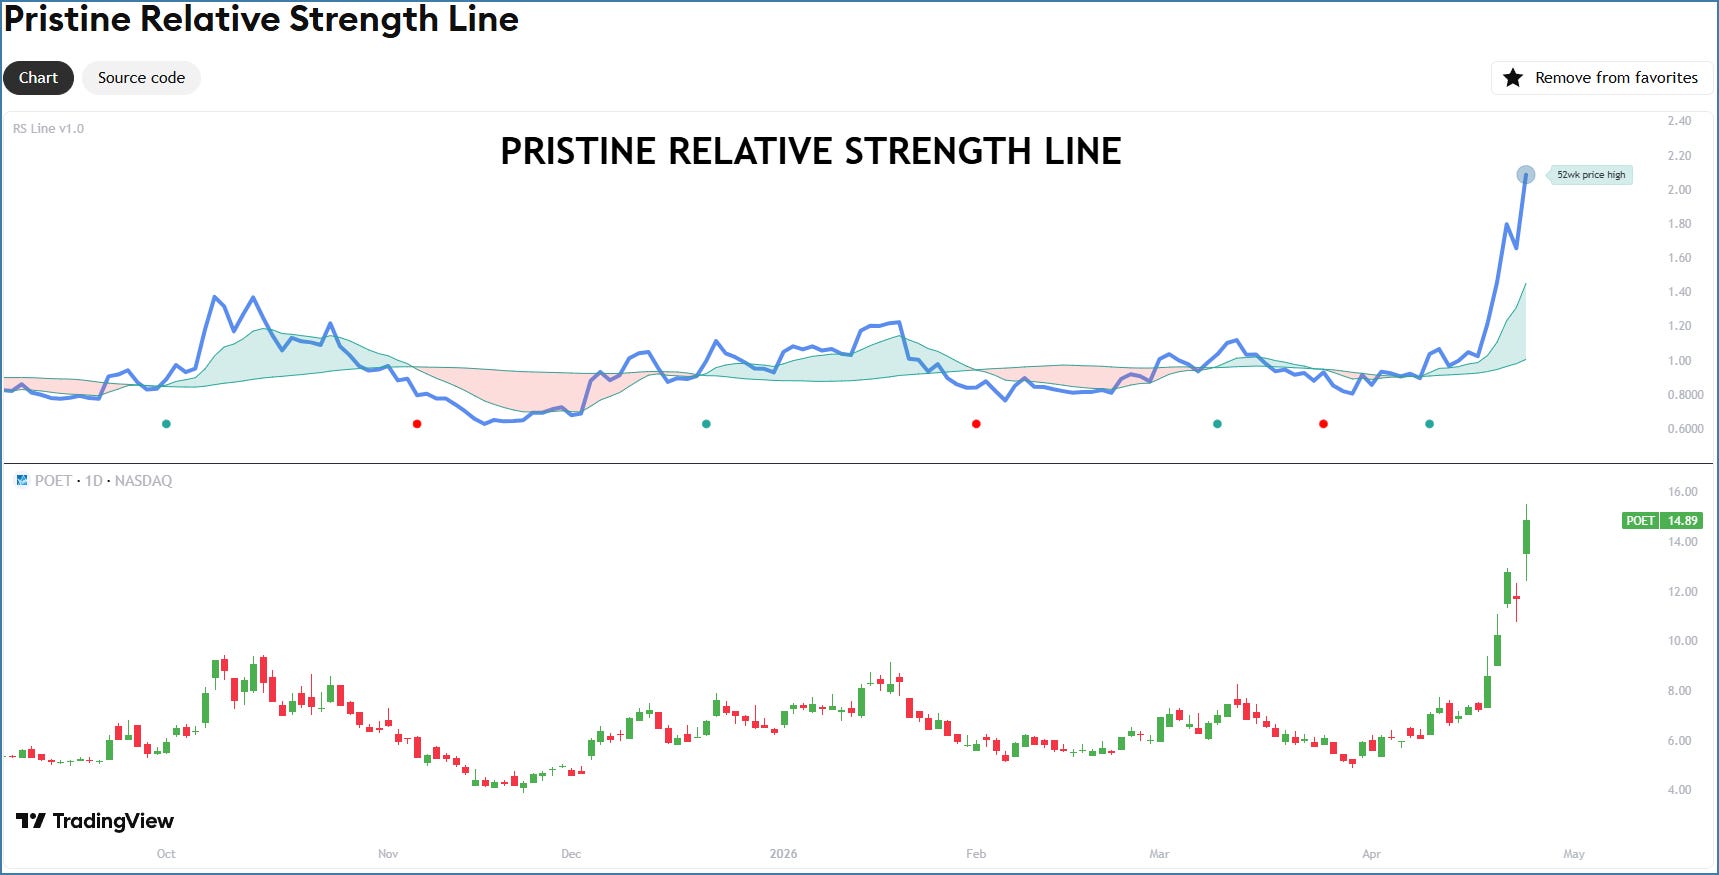
📈 Pristine Relative Strength Line
Instantly identify which stocks are leading the market and which are lagging. The RS Line compares any stock against a benchmark to reveal true relative performance — the foundation of momentum-based stock selection.
Key Features: RS Line & MA Cloud, MA Crossover Signals, RS New High Detection, 52-week Price High Label
🏆 The Premium Suite (Institutional Grade)
The complete "techno-fundamental" infrastructure I use to manage my own capital.
I rely on every tool in this suite to manage my own capital. As a competitor in the US Investing Championship ($1MM+ Money Manager Division), I cannot afford to use inferior infrastructure. I built these indicators to give myself an edge, and I am offering them to you because I believe they are the best on the market.
Ready to join? Use code PRISTINECOMMUNITY for 20% off🎁
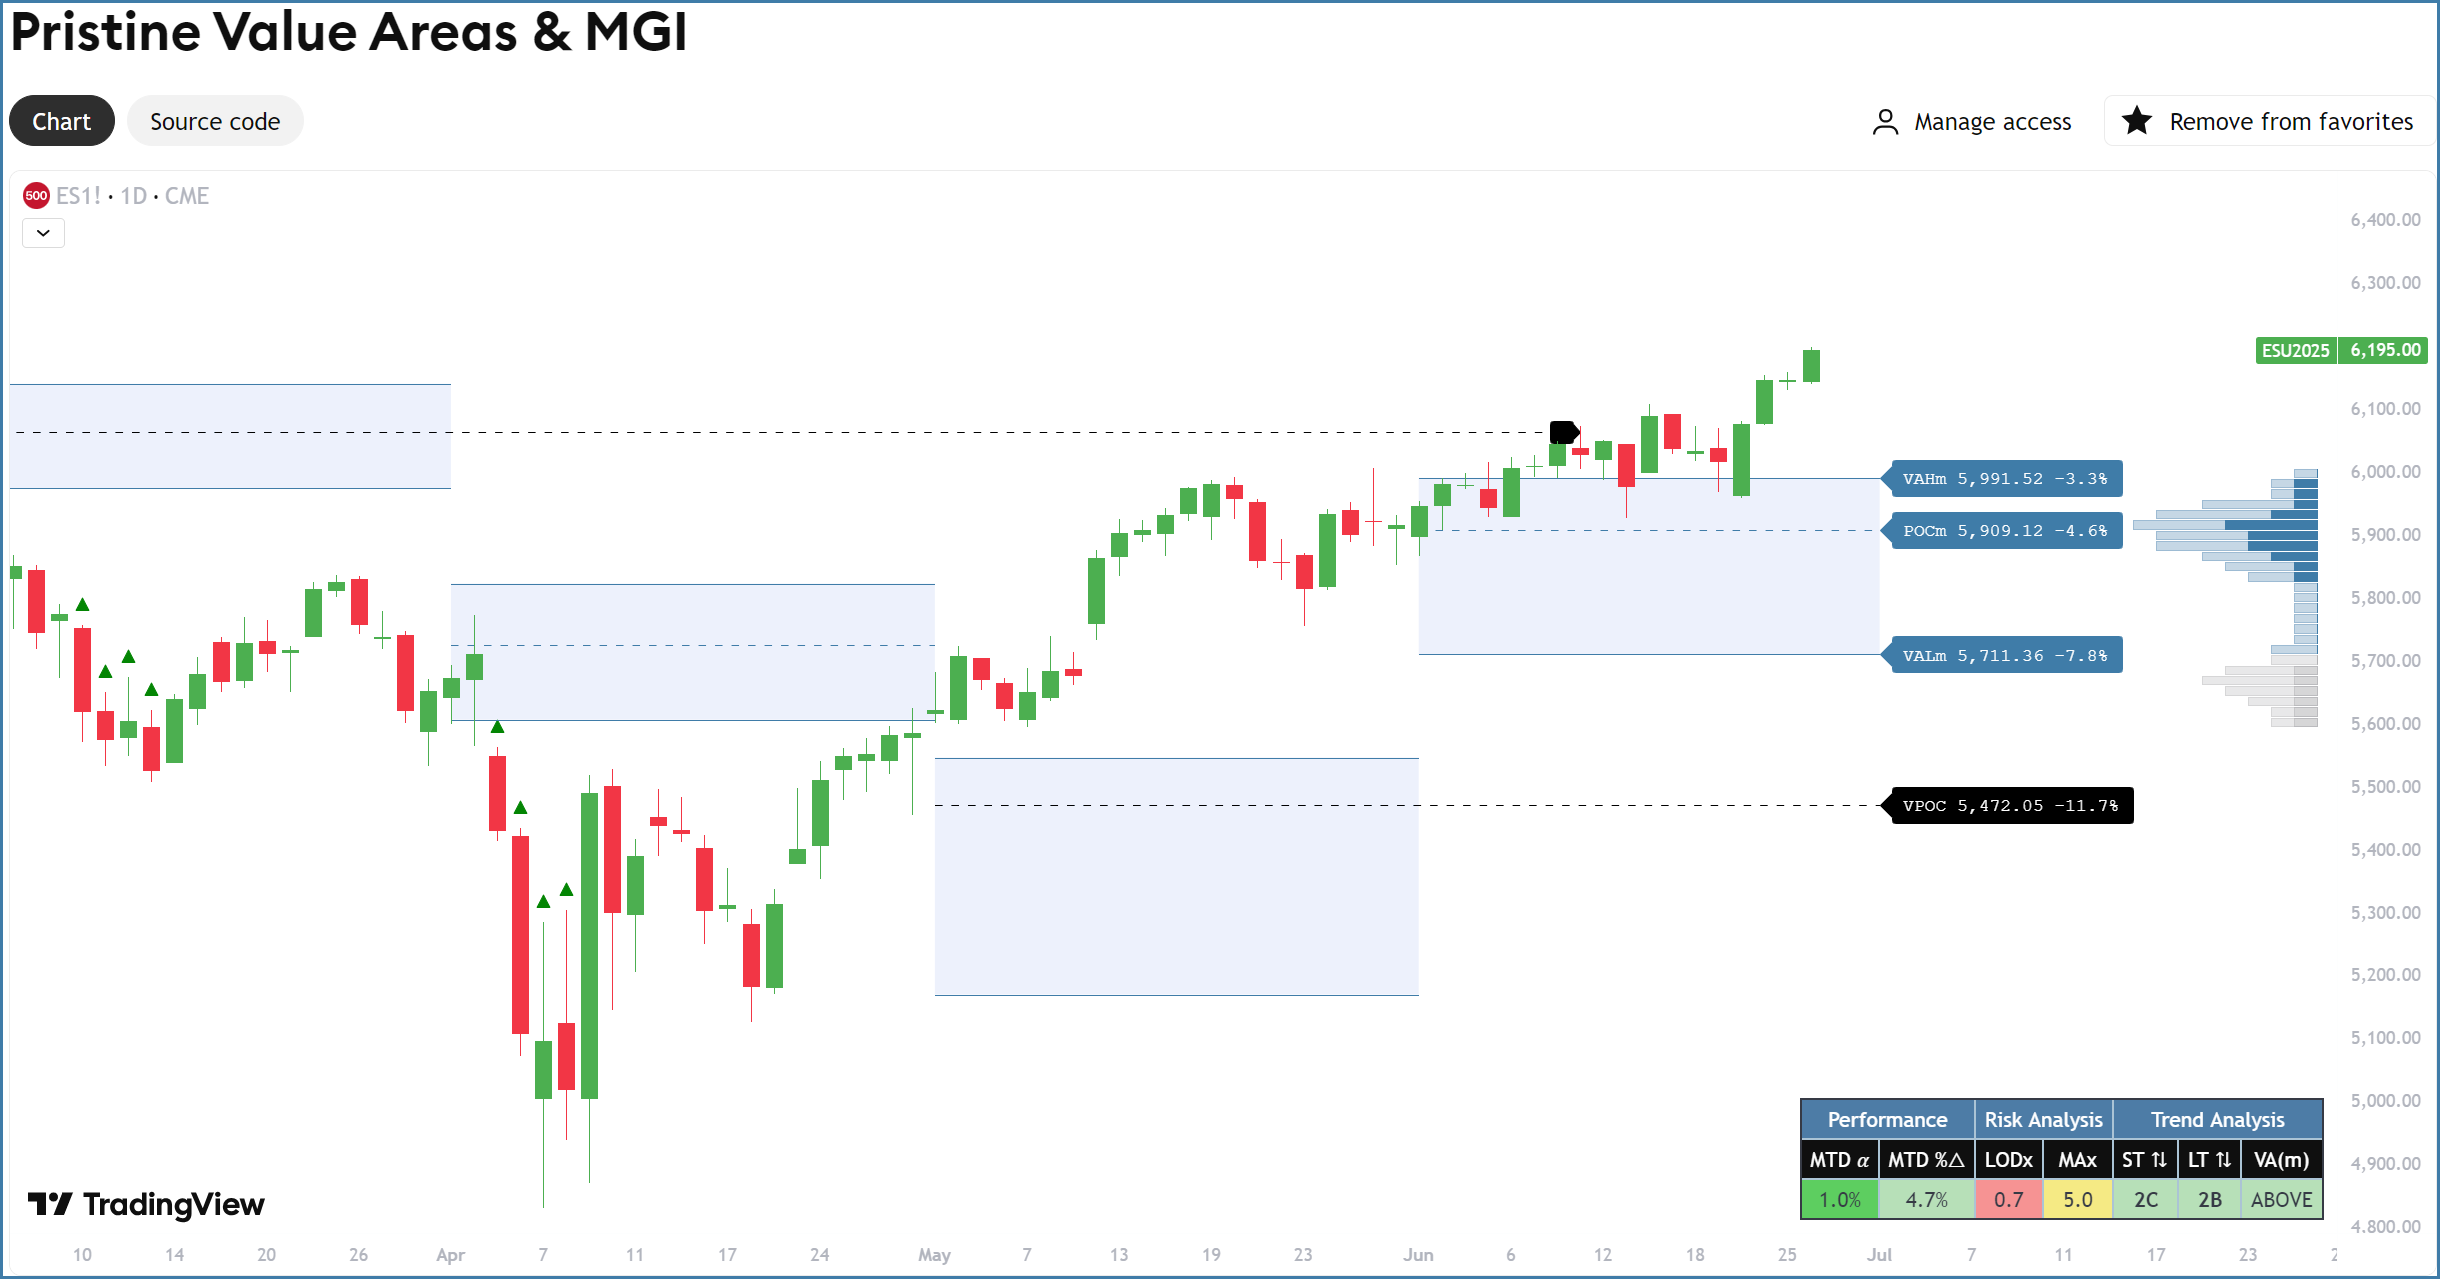
The cornerstone of my technical process. This tool automatically renders key Market Profile structures (VAH, VAL, POC, and VPOCs) across multiple timeframes, helping you instantly identify market regimes.
Why it matters: It gives you a repeatable way to filter price action. Either a specific setup is triggering (like an 80% Rule or Value Area Breakout), or it’s just noise.
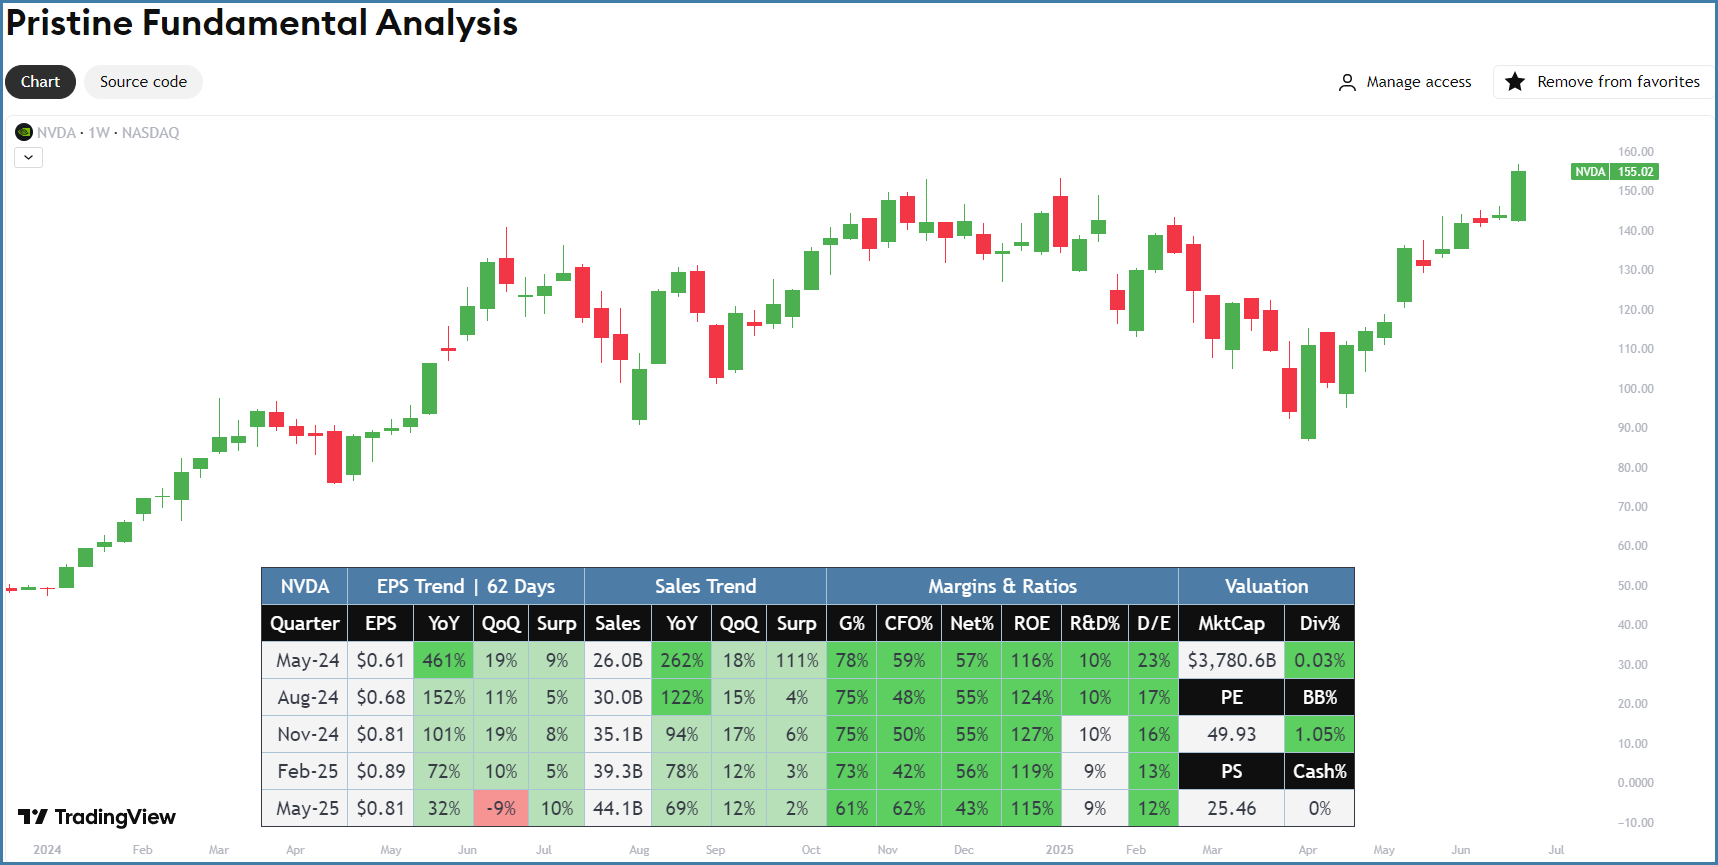
📊Pristine Fundamental Analysis
Eliminate the friction of checking fundamentals. This indicator overlays critical data (EPS, Sales, Margins) directly onto your technical charts, helping you spot the fundamental transitions that drive explosive price action.
Why it matters: It’s not just about good vs. bad numbers; it’s about context. This tool allows you to instantly gauge where a company sits in its business cycle, helping you better understand the potential reward and risk of the specific setup you are trading.
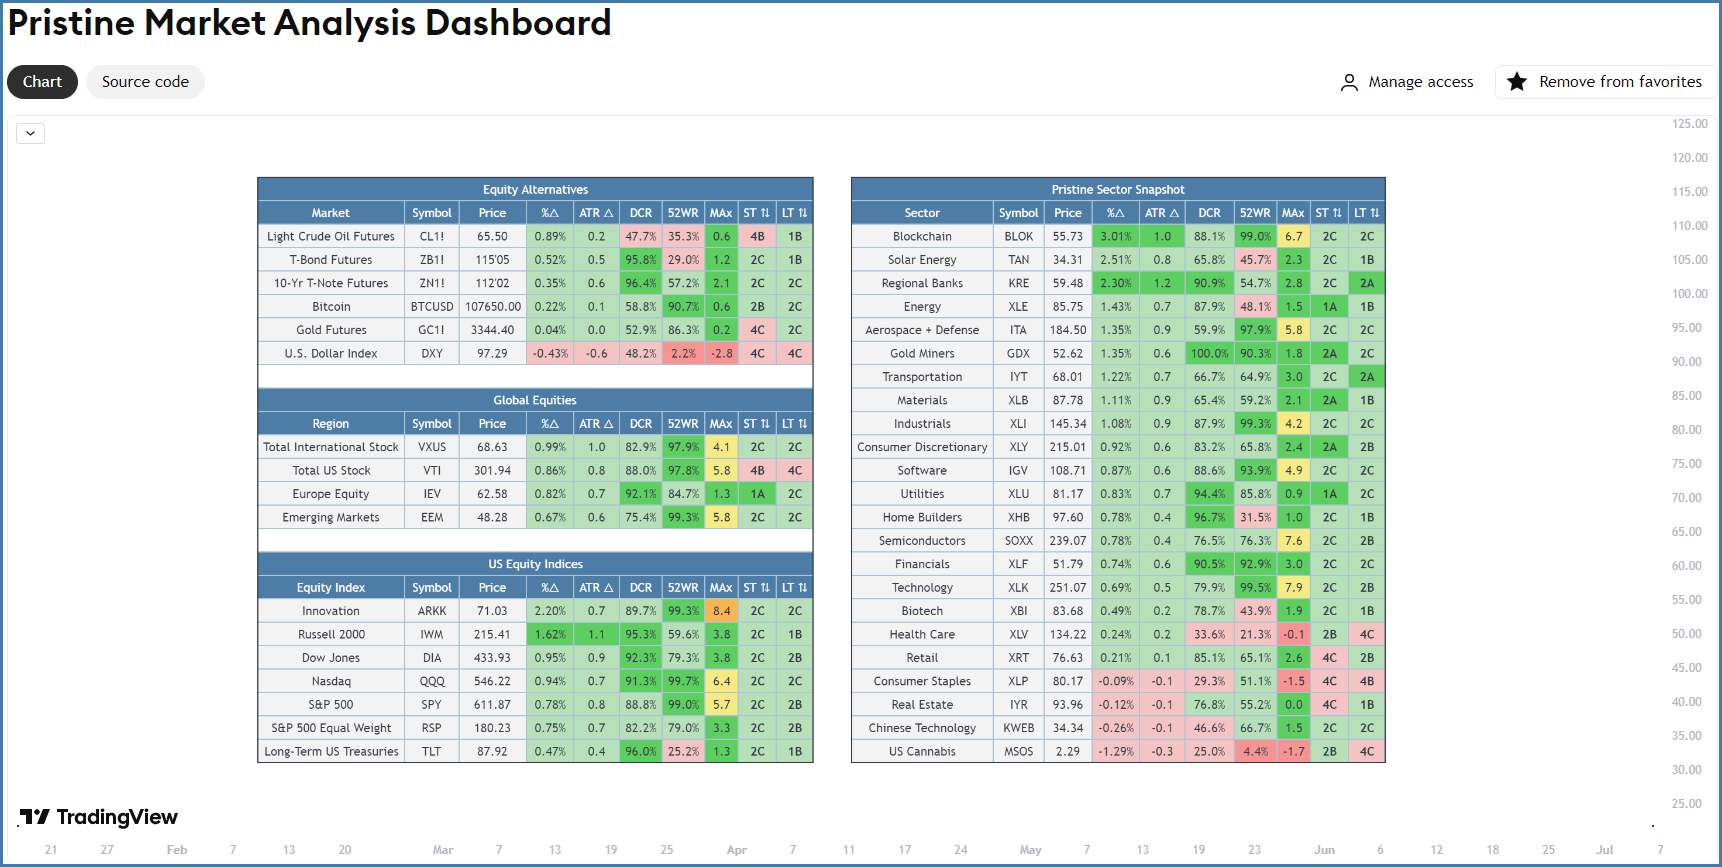
This dashboard is the ultimate tool for situational awareness. It aggregates trend data across global geographies, asset classes, and sectors, allowing you to digest the entire market landscape in a single glance.
Why it matters: It informs your highest-level decisions. Before looking at individual tickers, this tool tells you if the current environment favors the long side, the short side, or cash. It instantly points you toward the specific groups where the edge is strongest, ensuring you never swim against the tide.
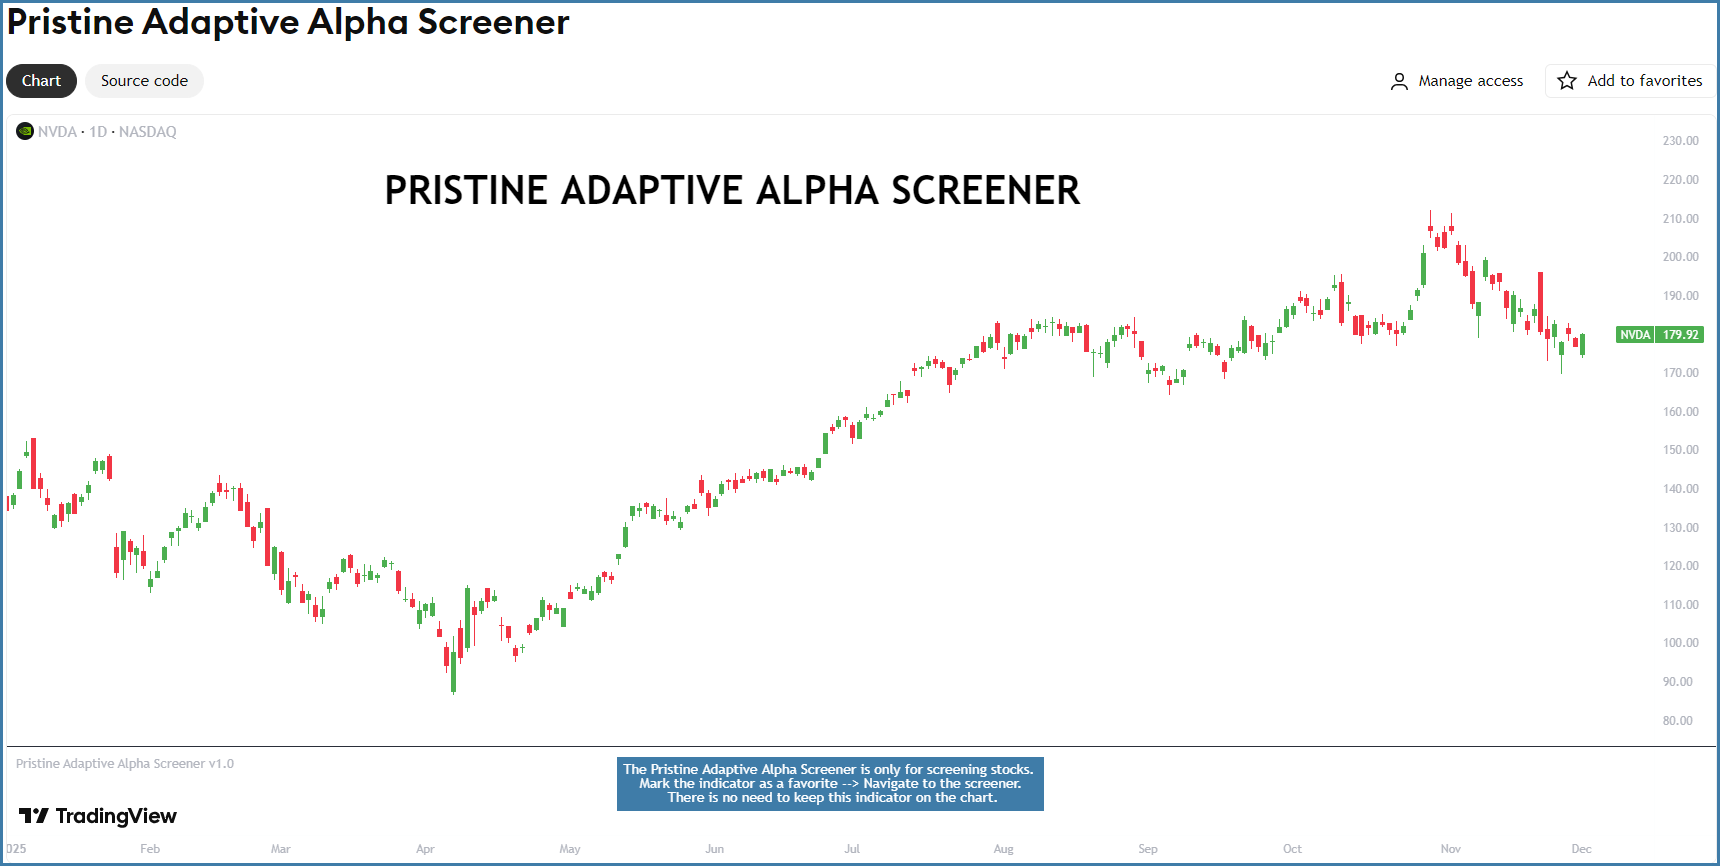
🎣Pristine Adaptive Alpha Screener
A custom-built scanning engine that identifies the exact technical and fundamental signals used in the Pristine Capital process.
Why it matters: It delivers high-probability setups directly to your watchlist. Whether you are looking for trend reversals (Bullish/Bearish 80% Rules), trend continuation signals (Break Above VAH / Break Below VAL), or fundamental outliers (Rule of 100), this tool ensures you capture every trading signal.
📚 Resources & Guides
Want to see these tools in action before you decide? Check out the deep-dive tutorials below.
📺 Unboxing the Pristine TradingView Indicators: [Link to YouTube Video]
📖 How to Set Alerts for Value Area Breakouts: [Link to YouTube Video]
📖 Using the TradingView Replay Feature (ONDS +145% Move: [Link to Article]
⚙️Conclusion
Trading is a game of probabilities, and the best traders stack the odds in their favor. This toolkit is a source of edge.
If you are ready to professionalize your approach, the tools are waiting for you.
Use code PRISTINECOMMUNITY for 20% off🎁
-Andrew O’Connell, CFA, FRM