


Introduction
I built this indicator to formalize relative strength analysis as a core part of the Pristine trading process. The best traders in the world tend to focus on the best stocks in the world, and this tool is designed to help surface those names. Just as importantly, it helps you pass on the underperformers.
The following educational article is adapted directly from the official documentation for the Pristine Relative Strength Line TradingView Indicator. To upgrade your workflow with our full premium suite of TradingView tools, visit the link below ⚙️
Without further ado. Let’s dive in!
💠 Overview
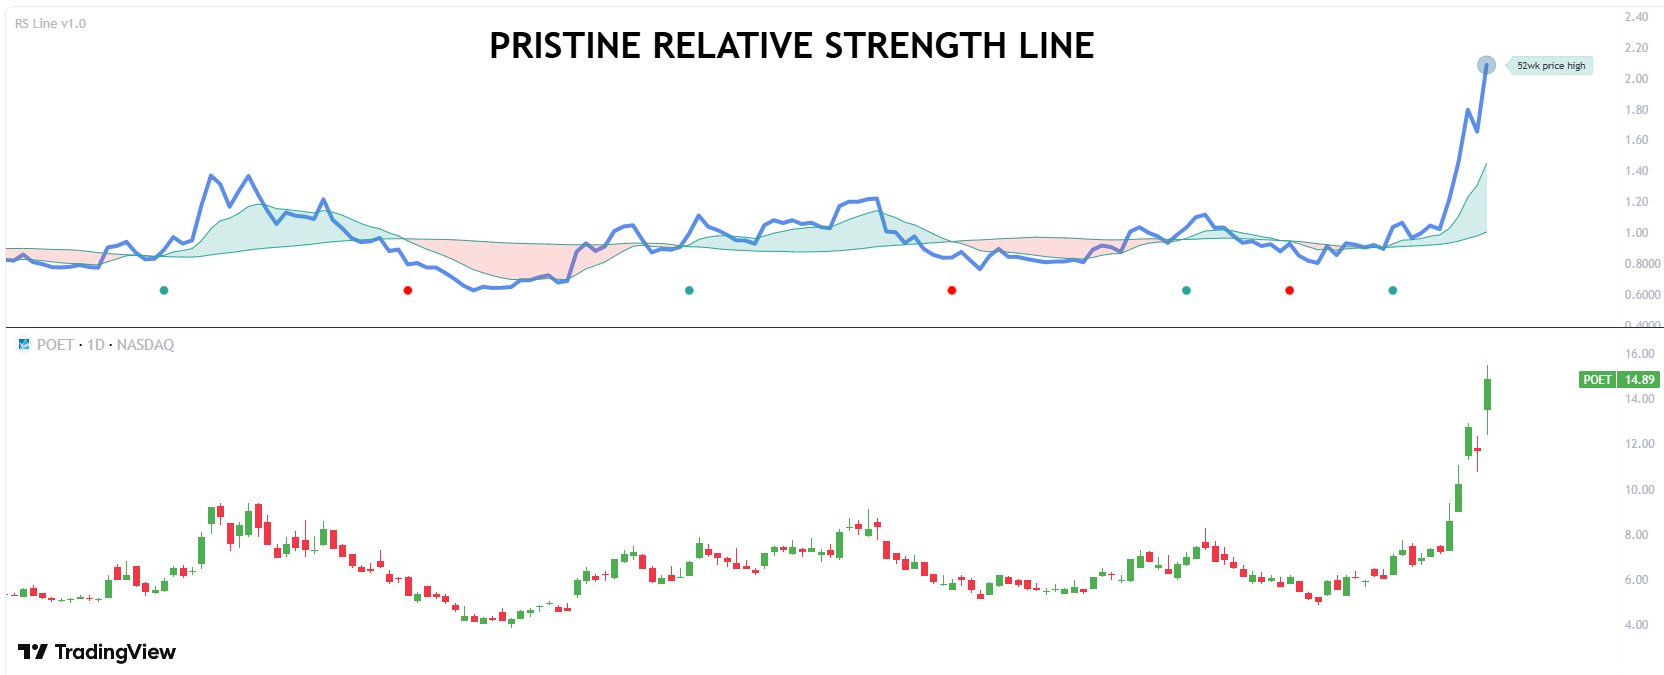
Pristine Relative Strength shows you how a stock is performing compared to a benchmark (default: SPY) — so you can quickly identify which names are leading the market and which are lagging 🏆
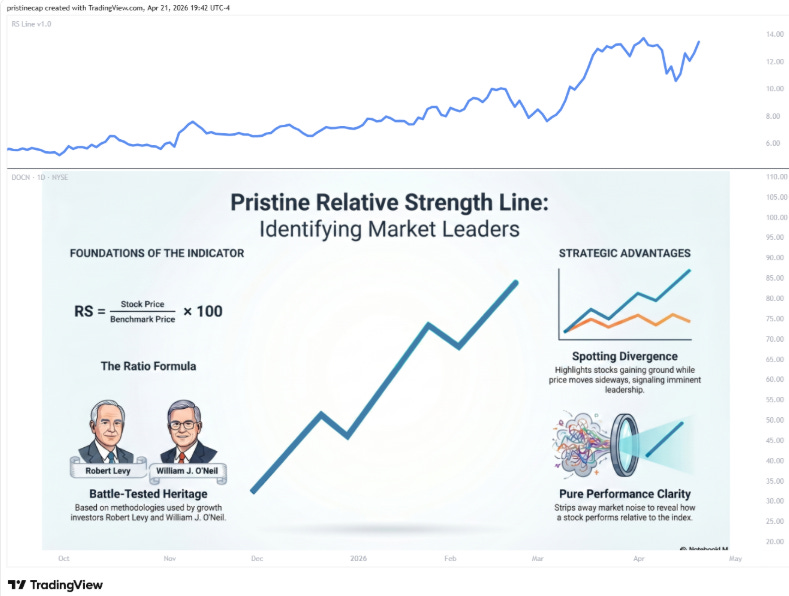
The concept of Relative Strength has deep academic roots. Robert Levy was among the first to formally research it in the 1960s, demonstrating in his 1967 book The Relative Strength Concept of Common Stock Price Forecasting that stocks with strong past performance tend to continue outperforming — a principle now widely known as price momentum. William J. O'Neil, the legendary investor and founder of Investor's Business Daily (IBD), later adapted this research into a practical trading tool, and it is O'Neil who created and popularized the RS Line as traders use it today. It remains one of the most enduring tools for identifying market-leading stocks.
The calculation is straightforward: the indicator divides the stock's price by the benchmark's price and multiplies by 100. The result is a line that rises when the stock is outperforming and falls when it is underperforming. No complicated math required to interpret it — if the RS line is trending up, the stock is gaining ground on the market. If it is trending down, the market is leaving it behind.
💠 Core Concepts
Concept 1: The Relative Strength Line
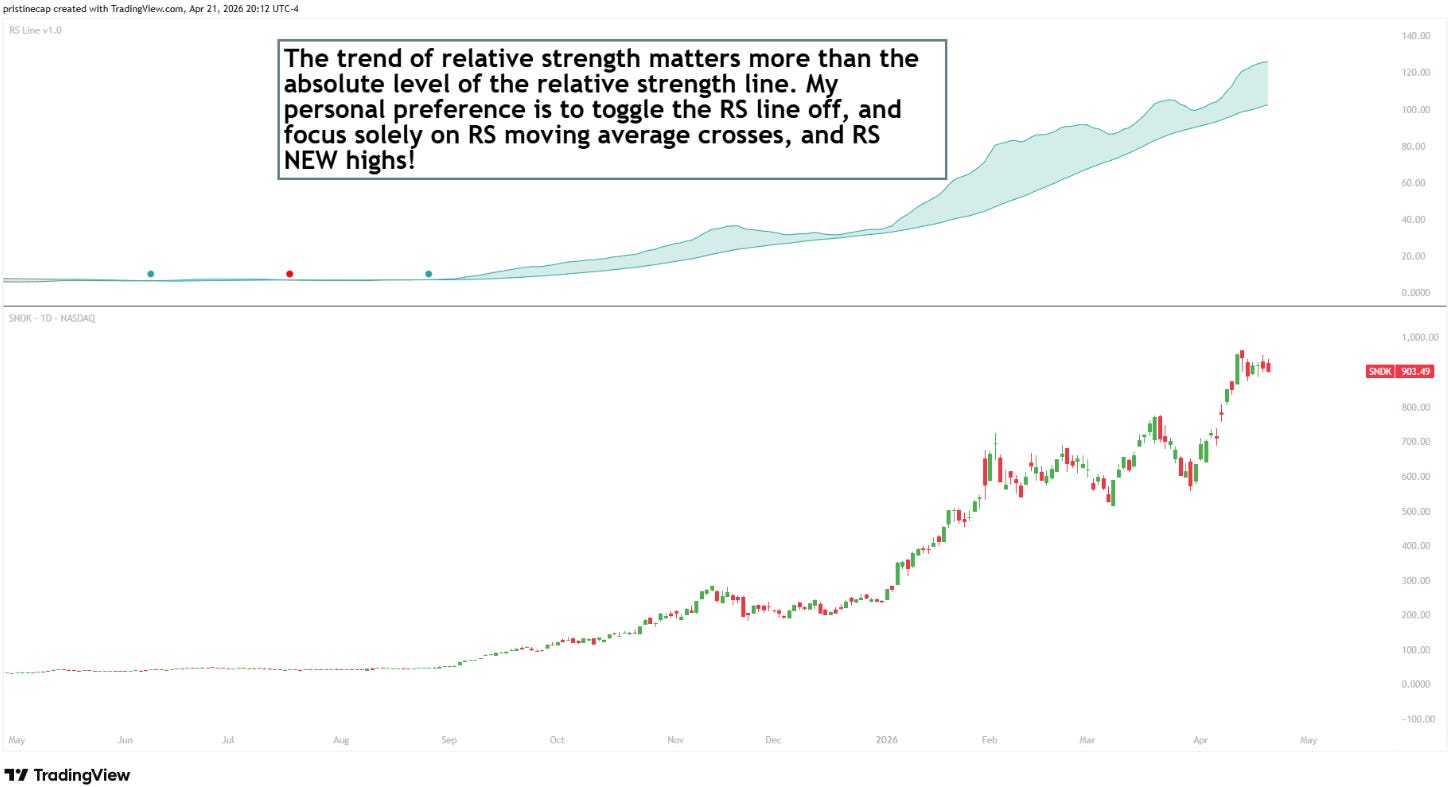
The RS line is a simple ratio: (Stock Price / Benchmark Price) × 100. What matters is not the absolute value of the line, but the direction and trend. A rising RS line means the stock is outperforming its benchmark. A falling RS line means it is underperforming. The steeper the slope, the stronger the relative move.
Concept 2: RS Moving Averages
Two moving averages are plotted on the RS line — a fast MA and a slow MA. These help smooth out short-term noise and make the trend of relative strength easier to read. When the RS line is above both MAs and the MAs are sloping upward, relative strength is in a healthy uptrend. When the RS is below its MAs, relative momentum is weakening.
Concept 3: MA Crossover Signals
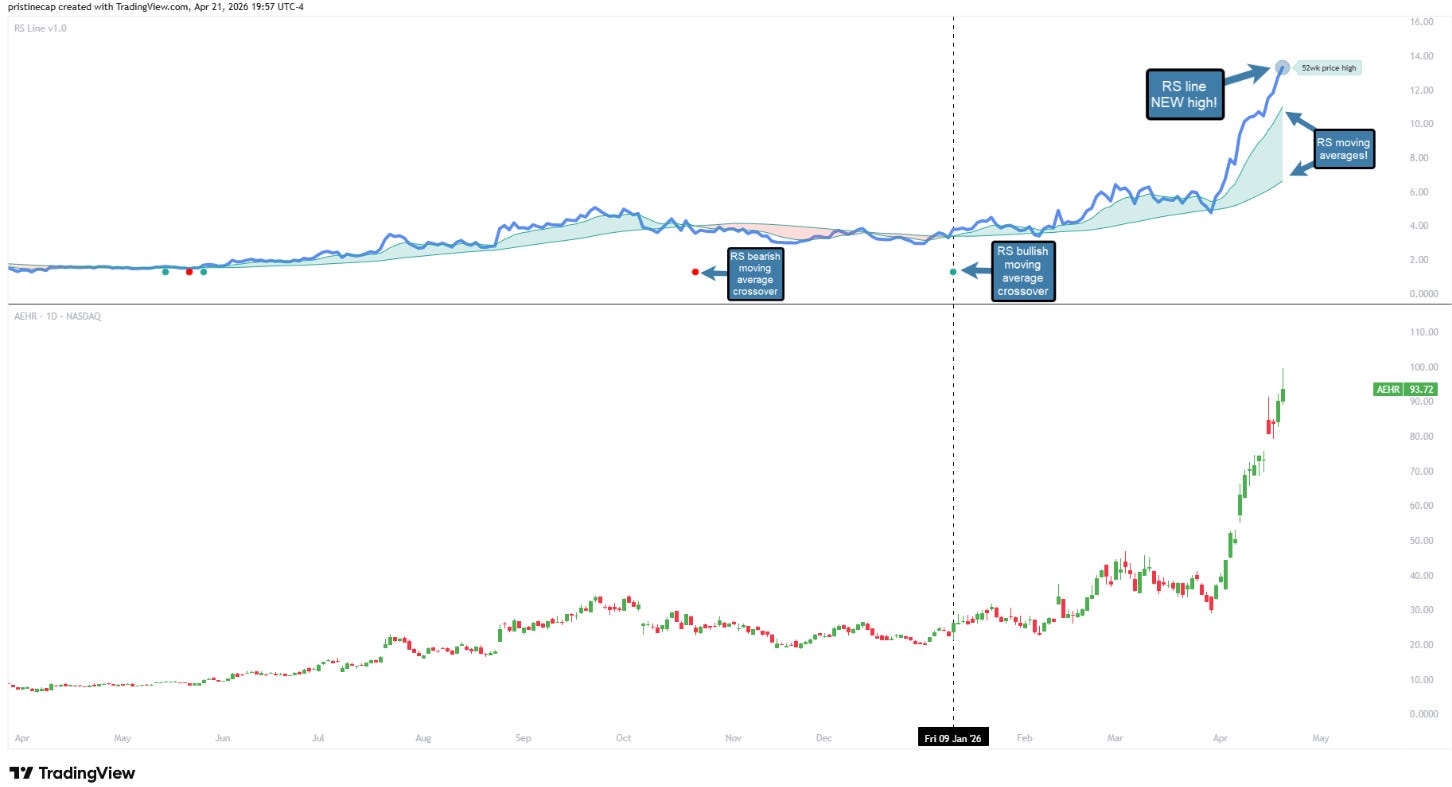
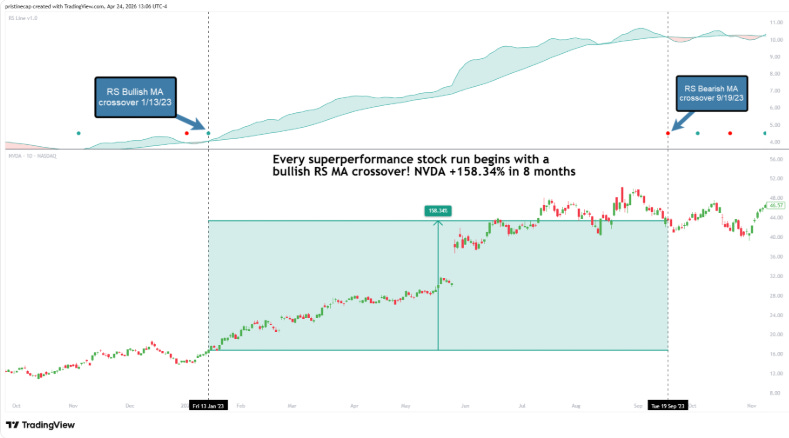
When the fast MA crosses above the slow MA, a bullish crossover signal appears at the bottom of the pane. When the fast MA crosses below the slow MA, a bearish crossover signal appears. These crossovers mark potential turning points in relative momentum — early signals that a stock's leadership or lag may be accelerating or reversing.
Concept 4: RS New High Signal
A signal appears on the most recent bar when the RS line is at its highest level over a user-defined lookback period. This is a meaningful event — it means the stock is outperforming its benchmark more strongly right now than at any recent point. Stocks that continually make RS new highs tend to be the true market leaders.
Concept 5: 52-Week Price High Label
When the stock's price is trading at a new 52-week high, a label appears to the right of the RS line. This is a simple but powerful confirmation tool — a stock making new price highs while also showing strong relative strength is one of the most bullish setups in the market.
💠 Key Features
RS Line
Why does it matter?
▪ RS trending up - The stock is outperforming the benchmark
▪ RS trending down - The stock is underperforming the benchmark
▪ RS above its moving averages - Relative strength is in an uptrend
▪ RS below its moving averages - Relative strength is in a downtrend
MA Cloud
Why does it matter?
The shaded cloud between the fast and slow MAs gives a quick visual read on the current trend of relative strength. A green cloud (fast MA above slow MA) signals improving relative momentum. A red cloud (fast MA below slow MA) signals deteriorating relative momentum.
MA Crossover Signals
Why does it matter?
▪ Bullish crossover - Fast MA crosses above slow MA, a sign that relative momentum may be turning up
▪ Bearish crossover - Fast MA crosses below slow MA, a sign that relative momentum may be turning down
RS New High Signal
Why does it matter?
▪ Appears only on the most recent bar — no clutter from historical signals
▪ Confirms that relative outperformance is at its strongest point in the lookback window
▪ Best used alongside other signals for added confluence
💠 Practical Use Cases
Use Case 1: Stock Selection
When scanning for trade candidates, prioritize stocks with a rising RS line that is above its moving averages. These are the names showing true relative leadership against the broad market — the ones most likely to continue outperforming.
Use Case 2: Sector Rotation
Apply the indicator to sector ETFs (XLK, XLF, XLE, etc.) compared against SPY to identify which sectors are leading and which are lagging. Rotate into sectors with rising RS and out of sectors with falling RS.
Use Case 3: Confirming Breakouts
A price breakout accompanied by a rising RS line and an RS new high signal adds significant conviction. A price breakout with a declining RS line is a warning sign that the move may not have broad momentum behind it.
Use Case 4: Avoiding Laggards
Before entering a trade, check the RS line. If the stock is underperforming its benchmark and the RS is trending down, consider passing — there are likely better opportunities elsewhere in the market.
💠 What Makes This Indicator Unique
▪ Clean, simple relative strength calculation — no unnecessary complexity
▪ RS New High signal that only appears on the most recent bar, keeping the chart uncluttered
▪ 52-week price high label for instant price/RS confluence confirmation
▪ Fully customizable moving averages with a visual MA cloud
▪ Built-in alert conditions for MA crossovers and RS new highs
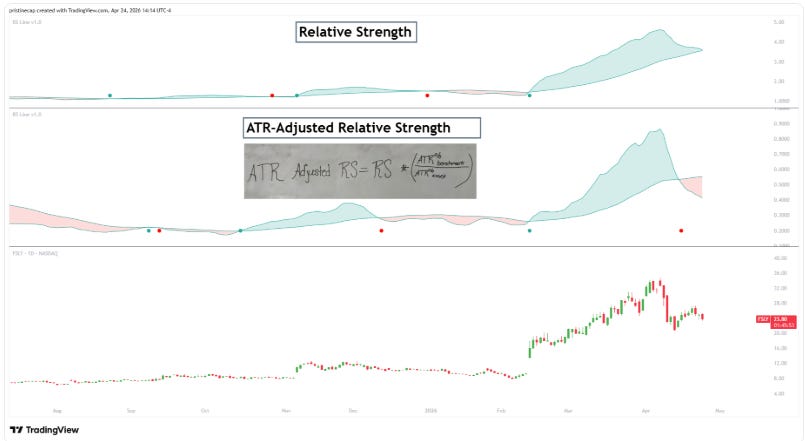
▪ Optional ATR% volatility adjustment for advanced users who want a risk-adjusted view of relative strength
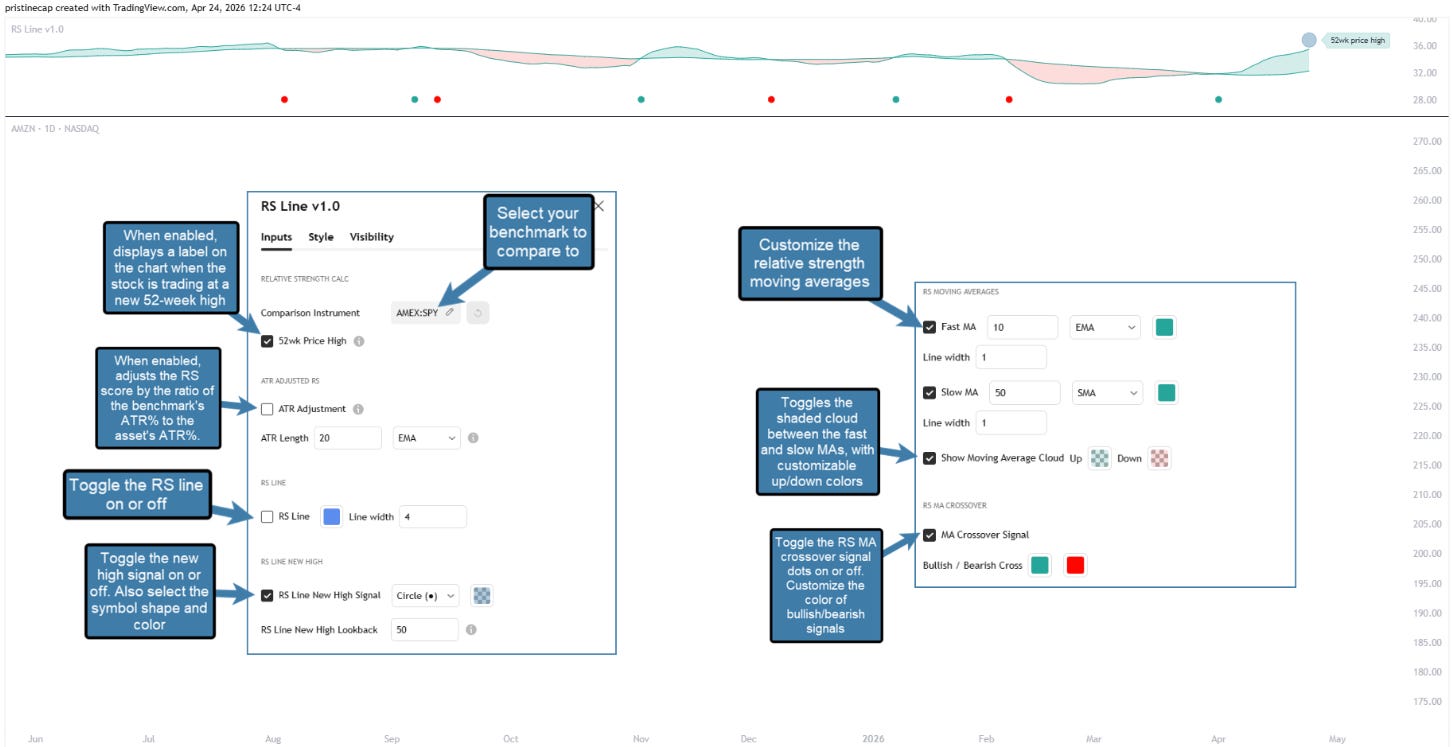
💠 Settings and Preferences
💠 Setting Signal Alerts
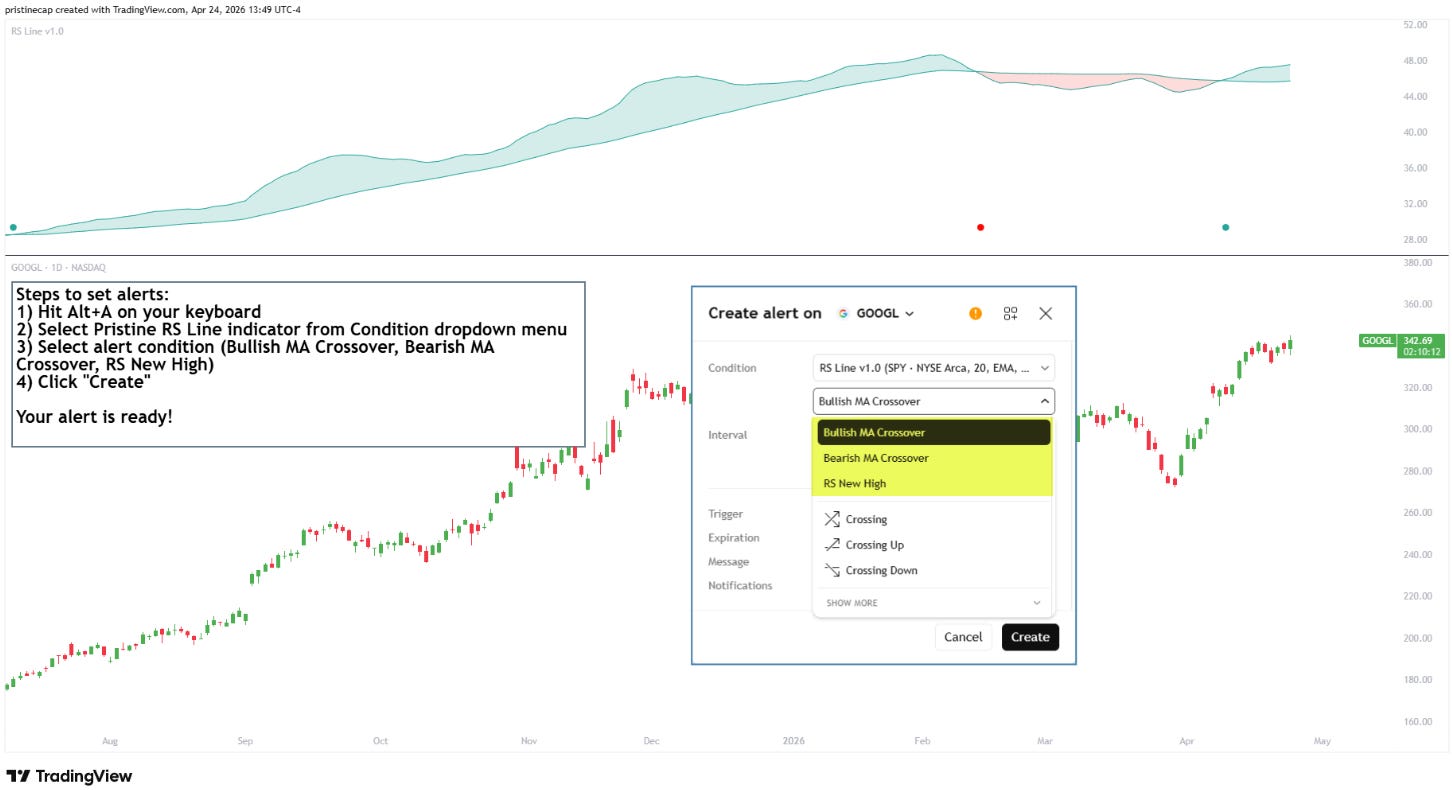
Steps to set alerts:
1) Hit Alt+A on your keyboard
2) Select Pristine RS Line indicator from Condition dropdown menu
3) Select alert condition (Bullish MA Crossover, Bearish MA Crossover, RS New High)
4) Click "Create"
Your alert is ready!
💠 Tips and Tricks
▪ The absolute value of the RS line is not what matters — focus on the direction and slope
▪ Compare stocks against their sector ETF instead of SPY to isolate stock-specific strength from broader sector moves
▪ The RS New High signal is most powerful when it occurs alongside a price breakout or a new 52-week price high
▪ Use the MA crossover alerts to get notified when relative momentum shifts, without having to watch the chart constantly
▪ A shorter Fast MA period makes the crossover signals more responsive; a longer period reduces noise but reacts more slowly
💠Subscribe
To upgrade your workflow with this indicator and our full premium suite, visit the link below
This looks pretty clean Andrew, I'm going to check it out!
Hi- Great relative-strength view, leader spotting before the breakout is key.
Cheers, LBT :-)