

Pristine Market Analysis & Watchlist - 1/12
Out with the CPI, In With Earnings!

Good evening everyone,
Congratulations. You just made it through the first CPI report of 2023!
We have a ton to cover tonight, so let’s dive in!
-Andrew
CPI Report
The day’s events kicked off with the US CPI report at 8:30 AM ET:
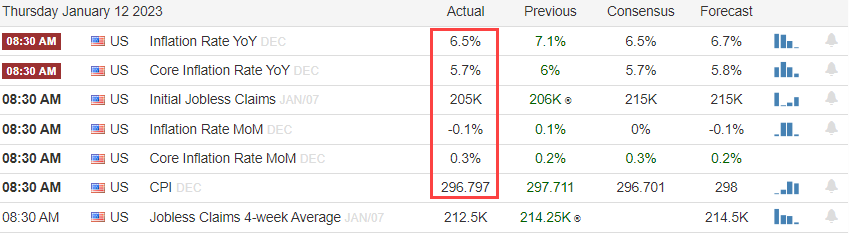
YoY Core and Non-Core inflation were reported in-line with estimates
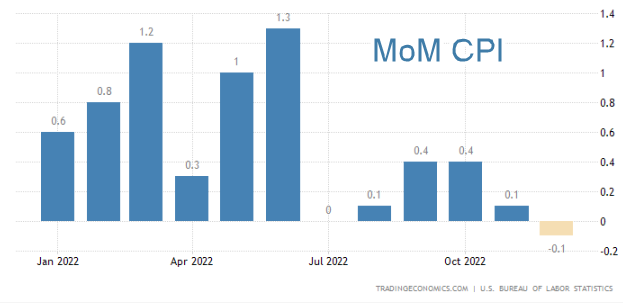
The US experienced it’s first MoM inflation decline since May 2020!
FX Market
The USD dollar index finished the session -.98%, which was a full ATR move:
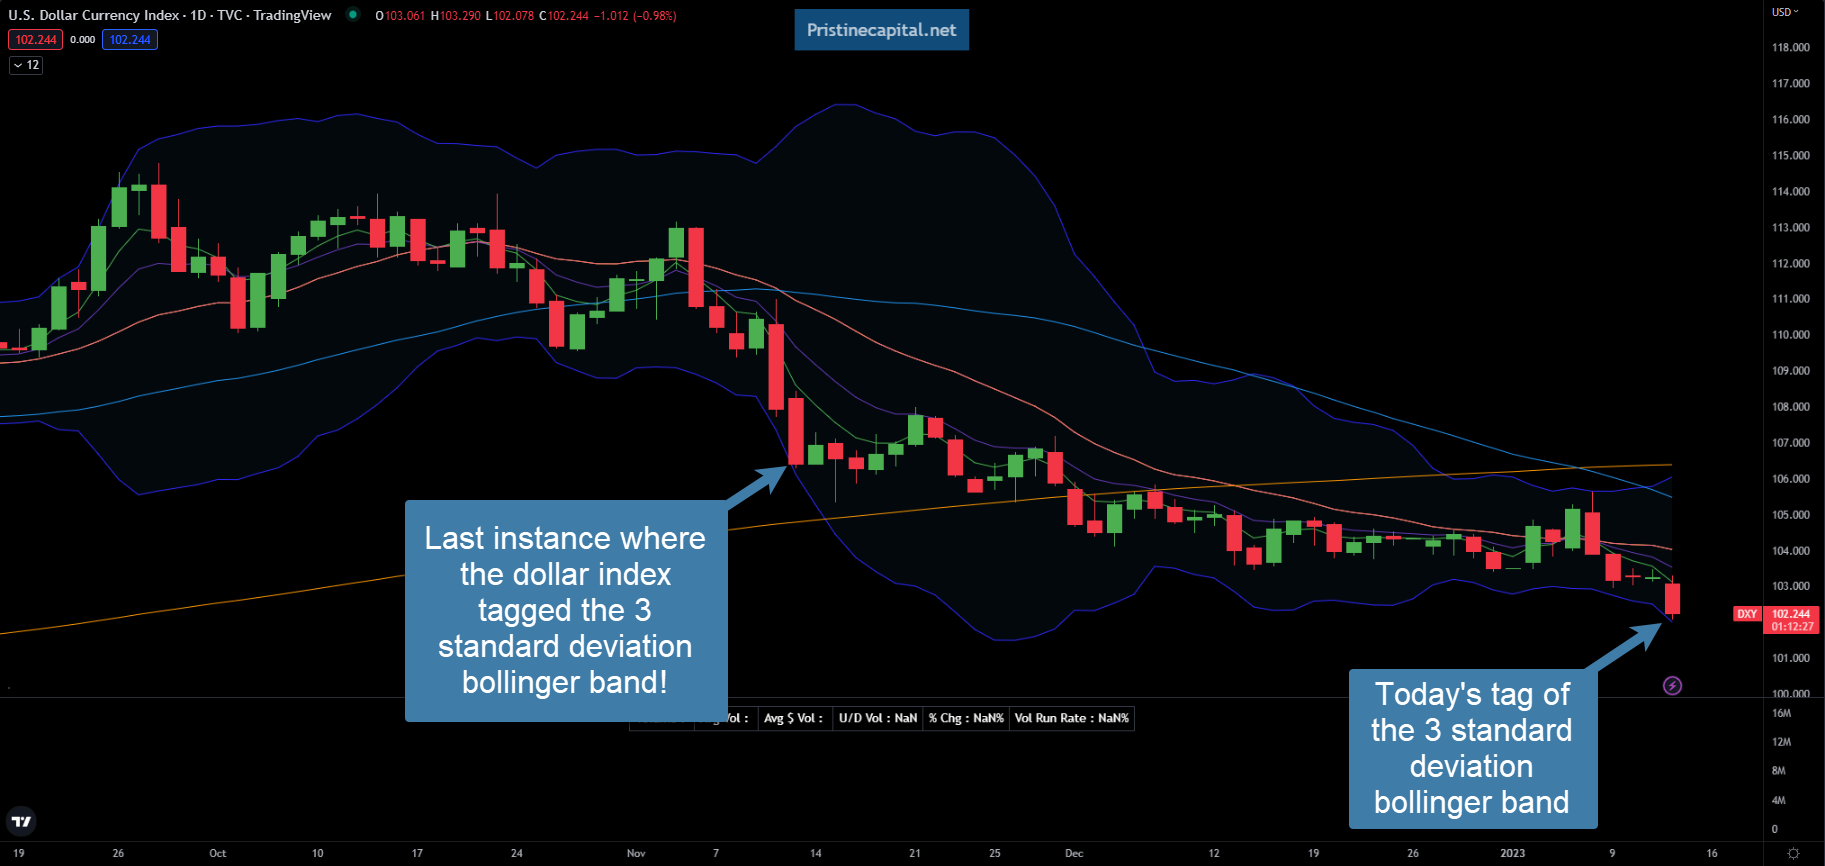
The dollar index tagged the 3 standard deviation bollinger band for the first time since 11/11 (oversold)
US Yield Curve
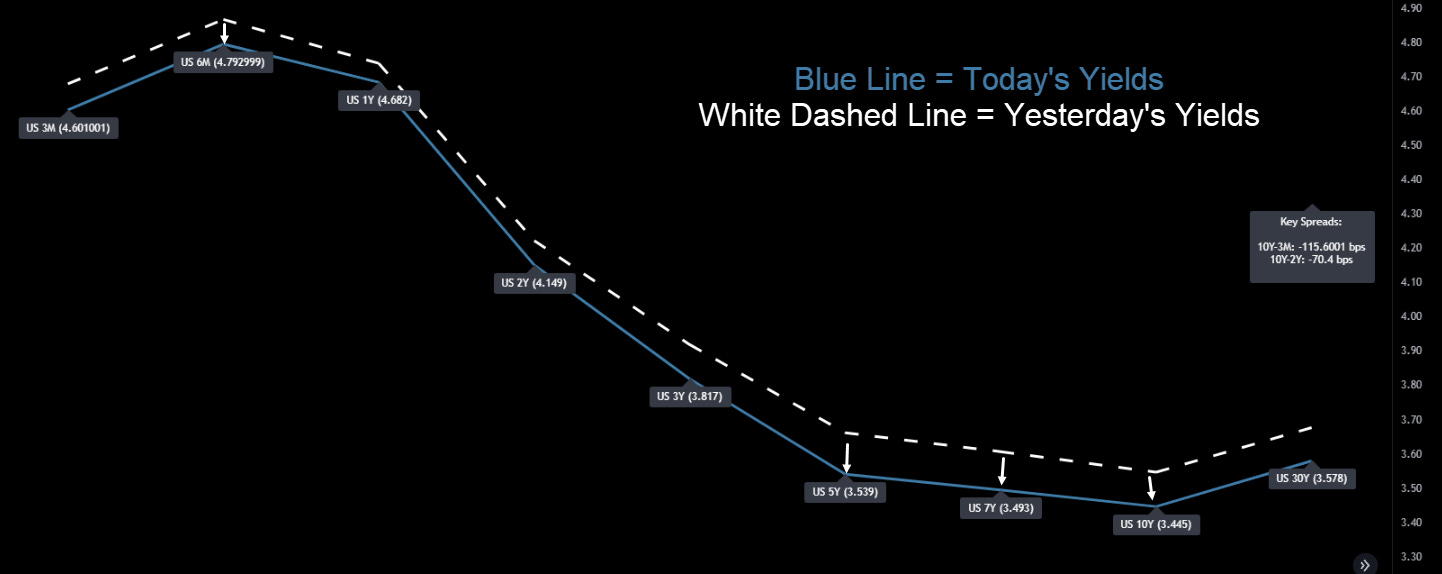
Yields across the curve moved lower, signaling that the bond market believes the fed will do less monetary tightening than previously expected, and/or future economic growth is going to slow down!
Equity Dashboard
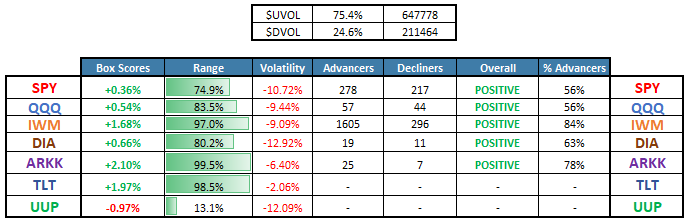
75.4% UVOL - Strong breadth
IWM and ARKK led the market
Volatility crushed across all tracked indices
Finviz Heatmap
For all the hype over CPI, today’s S&P 500 action was rather muted:
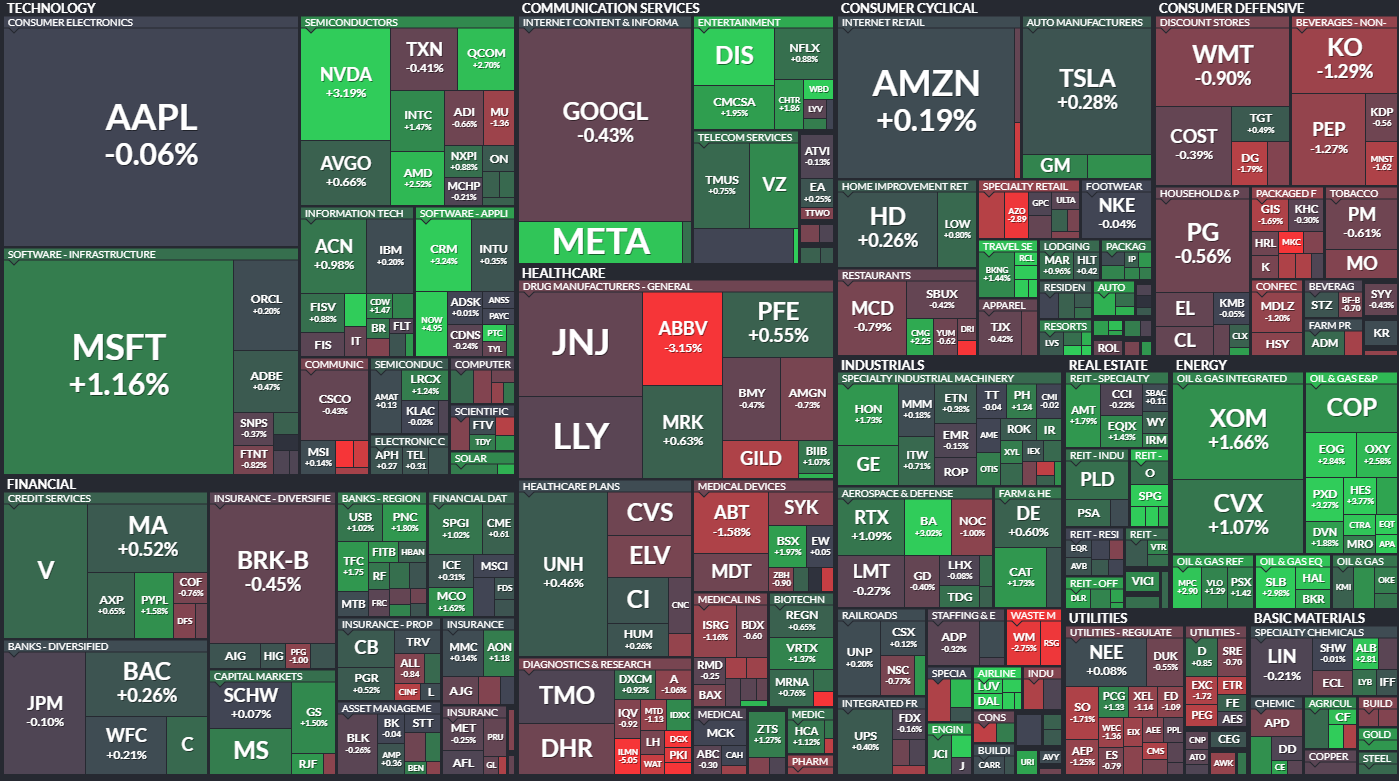
XLE Energy stocks were the strongest group
S&P 500 ES_F Price Analysis
The S&P 500 finished the session +.36%, and right on top of the teal downward trendline! The last three attempts to clear it were met with selling. Could this time be different?
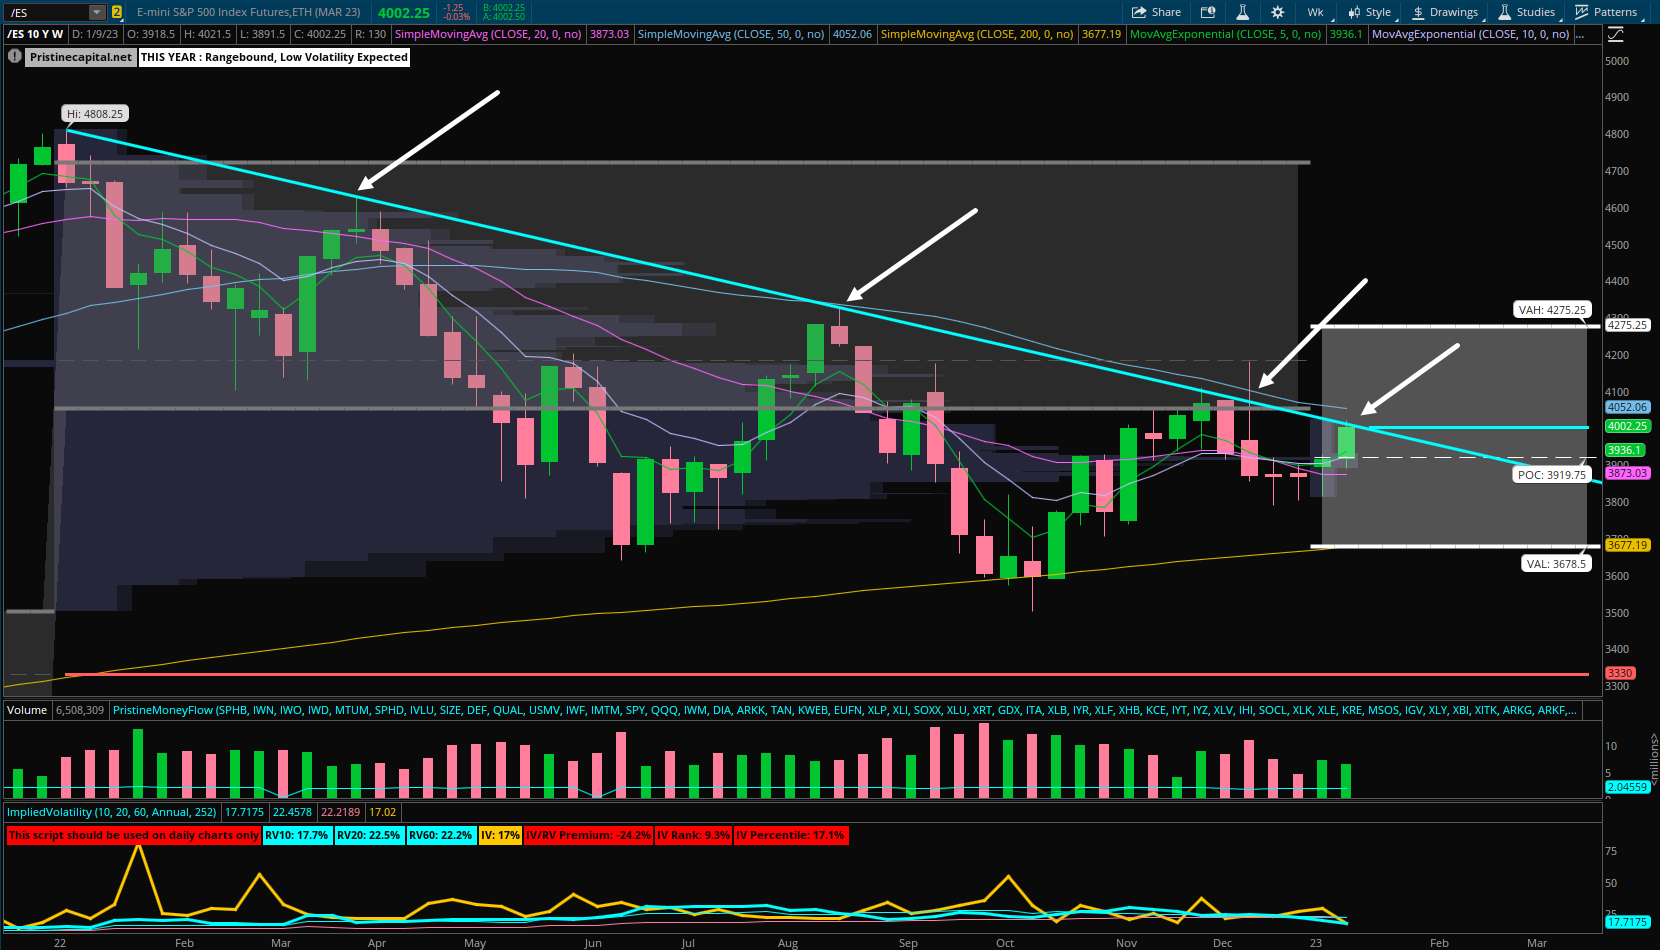
S&P 500 ES_F Breaking out of Value?
The teal downward trendline happens to coincide with the monthly value area high of ~4010.75:
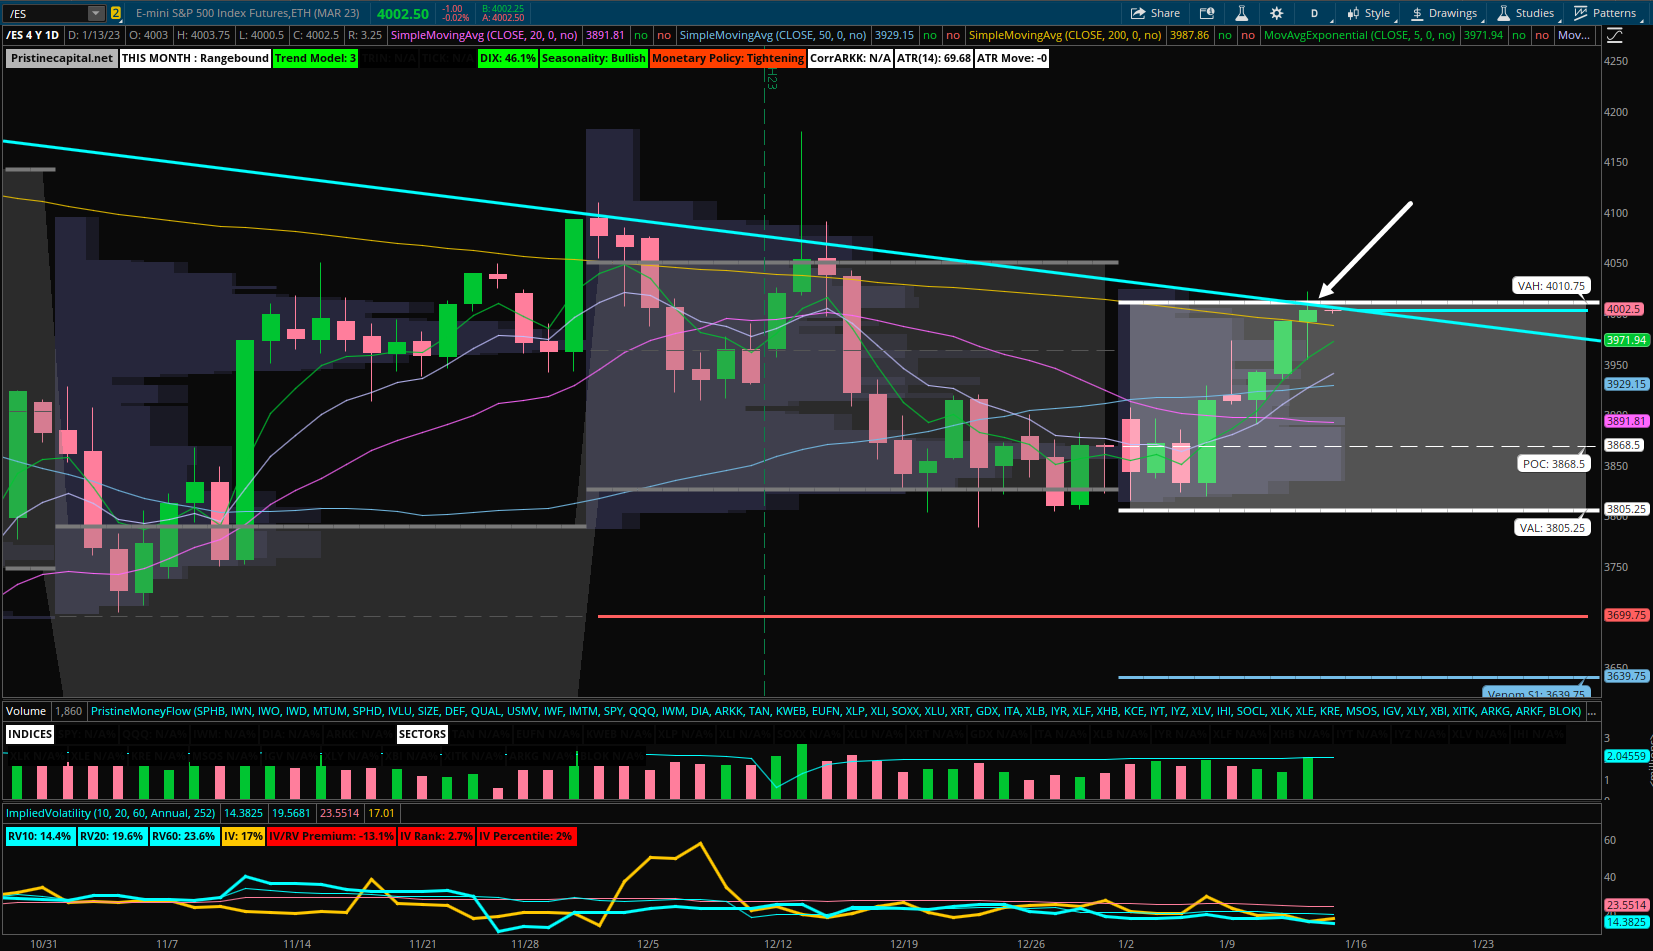
At these key price junctures, it is easy to get caught in a bias rather than following the price action and/or your trade plan. Don’t let that be you! Trade the market in front of you, not the market you wish to see!
Nasdaq NQ_F Price Action Analysis
The Nasdaq finished today’s session +.54% and above the 50-day SMA:
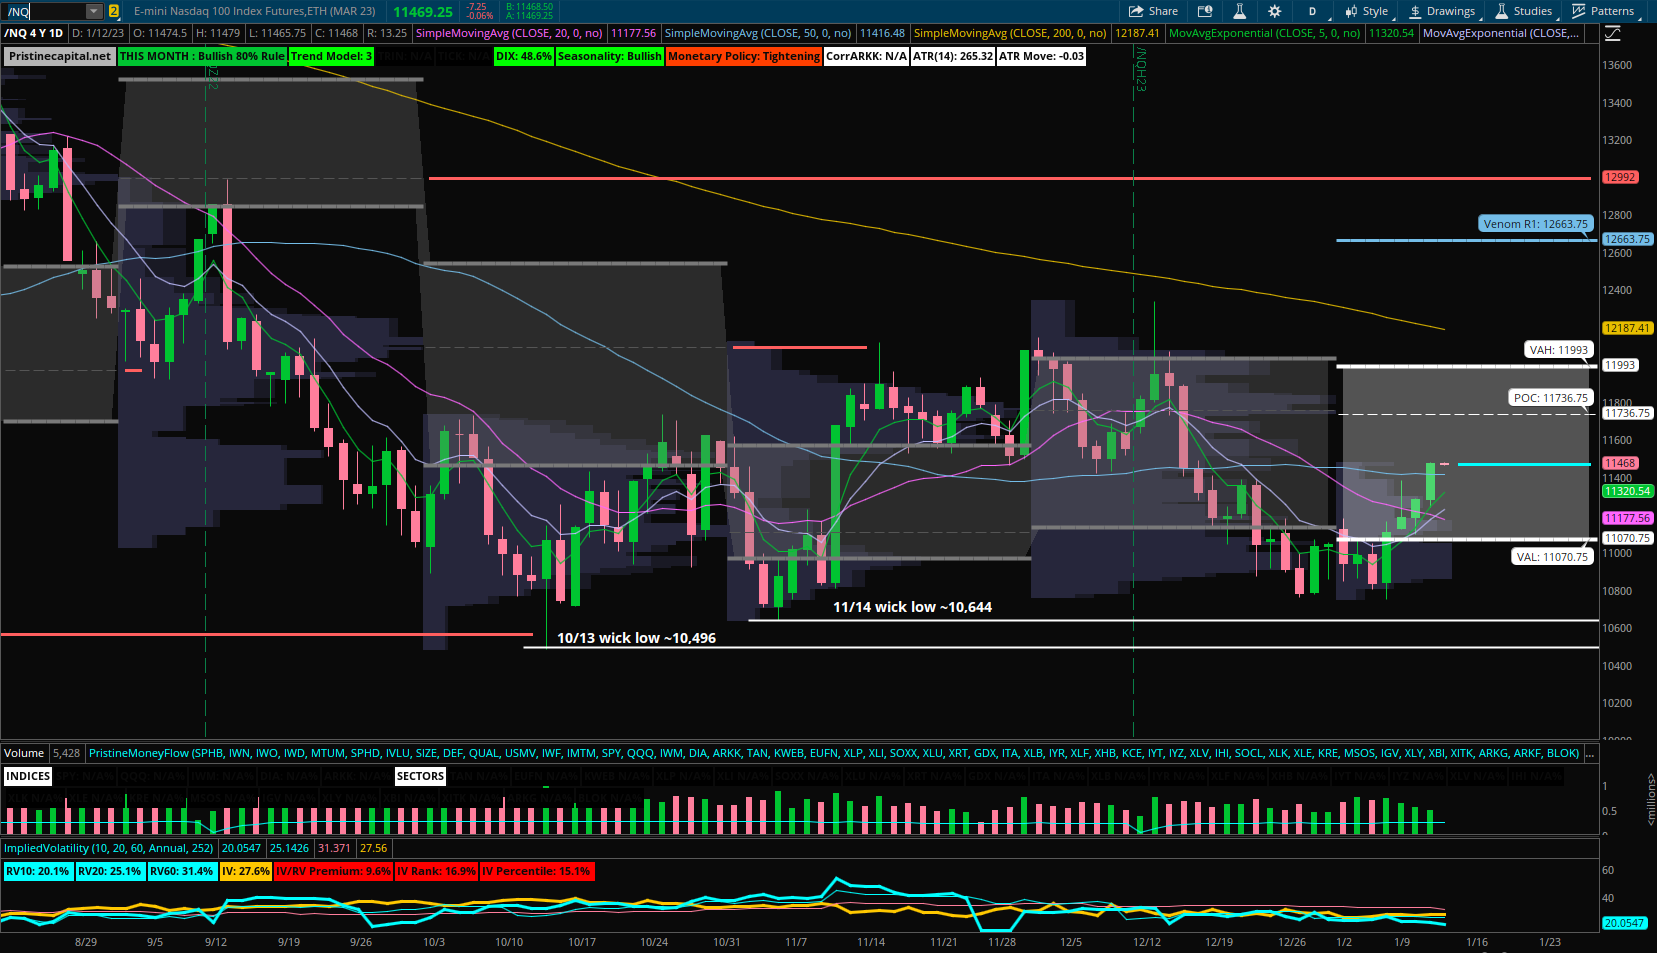
With earnings season kicking off tomorrow, most of the megacap tech stocks that comprise the Nasdaq will be reporting earnings in the next few weeks
Russell 2000 RTY_F Price Action Analysis
The small-caps are leading this leg higher in the market:
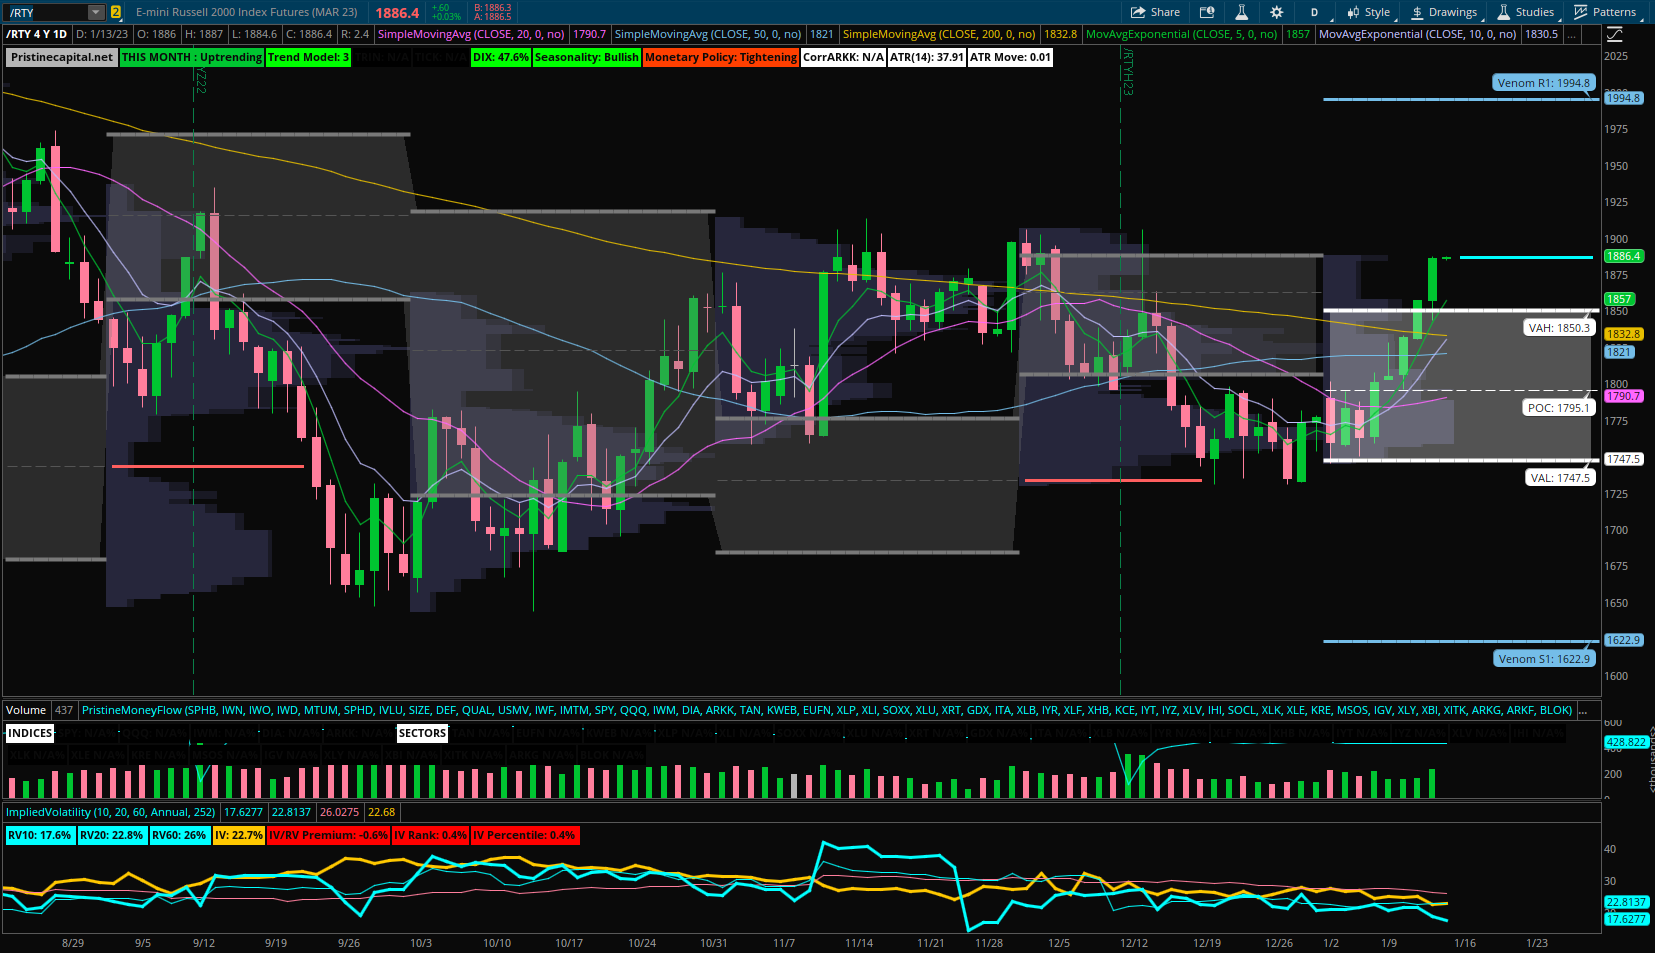
The Russell 2000 is ahead of the other headline indices in it’s price cycle, and is already trading above the monthly VAH ~1850.3
The Russell 2000 is challenging the December swing highs
Sectors - Ranked by Momentum
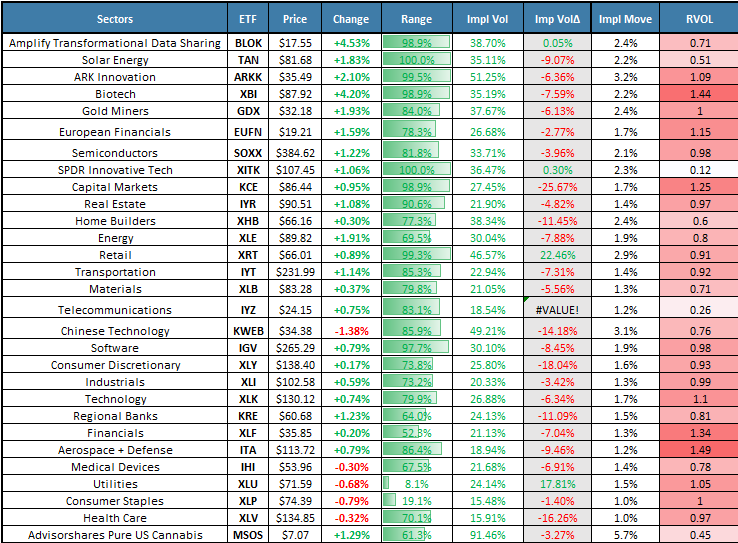
BLOK moved into the top momentum slot
Money is rotating from defensives XLV XLP into risk-on TAN ARKK XBI
Earnings on Tap

The banks kick off earnings season before the open tomorrow
I will be covering all of these reports and reactions in Discord
Key Takeaways
The CPI came out in-line with estimates
Today’s price action defies many of the consensus bearish macro narratives
This recent leg higher is being led by risk-on assets rather than defensives
In the following sections of tonight’s update, I’ll cover my research in preparation for tomorrow’s trading session
✅ Trend Model Update - Our proprietary indicator that informs us on how aggressive/defensive to position in the market
✅ One of my proprietary risk models and the signal it is sending
✅Market Strategy - My trading plan post-CPI
✅ Today’s Trade Blotter and Position Update
✅Daily Watchlist - We scan thousands of stocks and hand-pick the best reward/risk opportunities
