

Pristine Market Analysis & Watchlist 2/27
Hanging on By a Thread

Team,
If you’re reading this, you’ve made it to month-end! The second inning of our 12 inning game is coming to a close. Friendly reminder to consider reducing screen-time and/or trading volume if you are having a much tougher February than January!
I can tell via my interactions on spaces, Twitter, and DM’s that traders are already experiencing burnout.
We must pace ourselves for a marathon. It’s too early in our race to gas out! Keep your head up…and off the 1 minute candles. We’re all going to make it👊
-Andrew
Economic Data
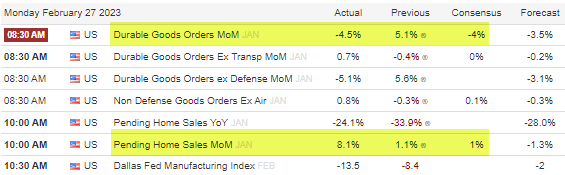
Durable goods orders came in below estimates, which put bonds and equities on a positive trajectory early on in the session. Weak economic data implies increased recession odds, which implies lower future inflation, which implies a more dovish fed. We remain in ‘bad-news-is-good-news’ environment for the time being. Pending home sales came in significantly higher than consensus estimates at 10 AM, and with that release the markets lost their upside momentum.
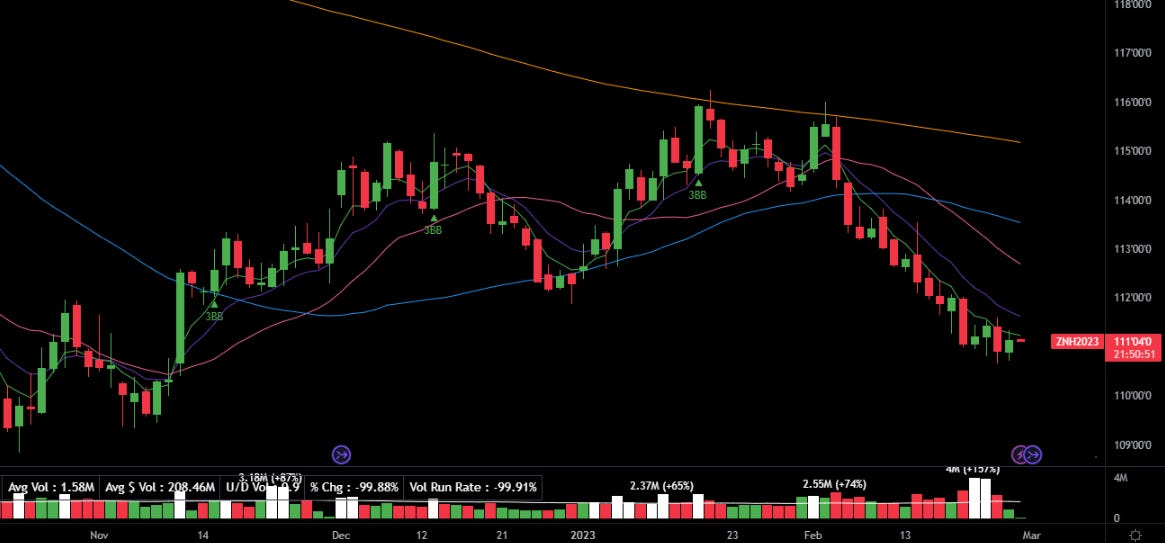
The ZN_F 10Yr treasury futures contract put in a green candle, which is a small win when compared to the relentless selling we’ve seen over the past few weeks. With this said, let’s at least reclaim the 5-day EMA before declaring victory! The chart still looks ugly.
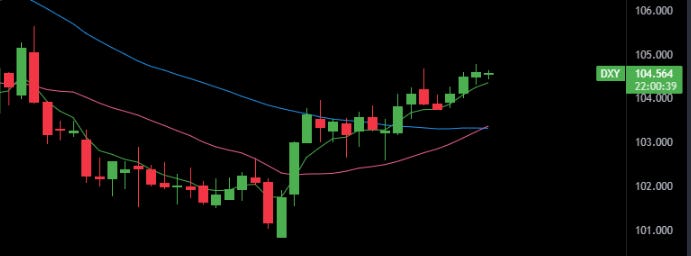
The DXY dollar index finished -.50%, which is another incrementally positive development. Dollar strength tightens financial conditions.
Equity Dashboard
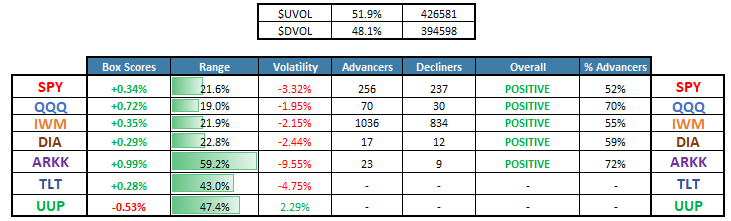
Market breadth was mixed with 51% advancers. Equity indices finished in positive territory, but had weak closing ranges.
ES_F S&P 500 Price Action Analysis
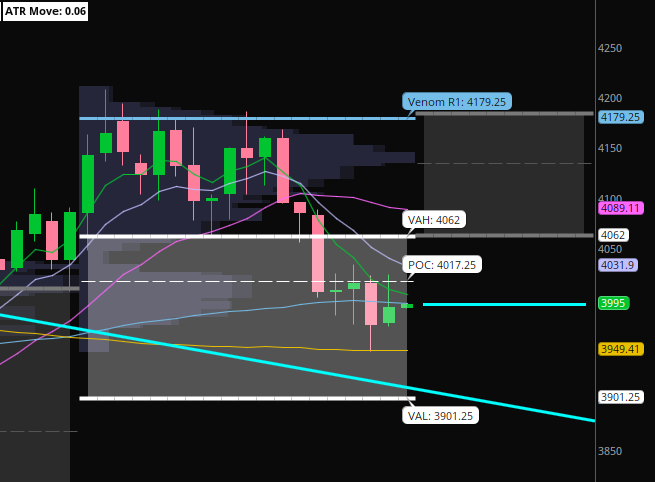
The S&P 500 topped on Feb 2nd, and has been stair-stepping lower in a narrow channel ever since. We are trading in the ultimate no-man’s land.
Inside the monthly value area
Under the monthly POC ~4,017.25 and the short-term moving averages
Above the 200-day SMA
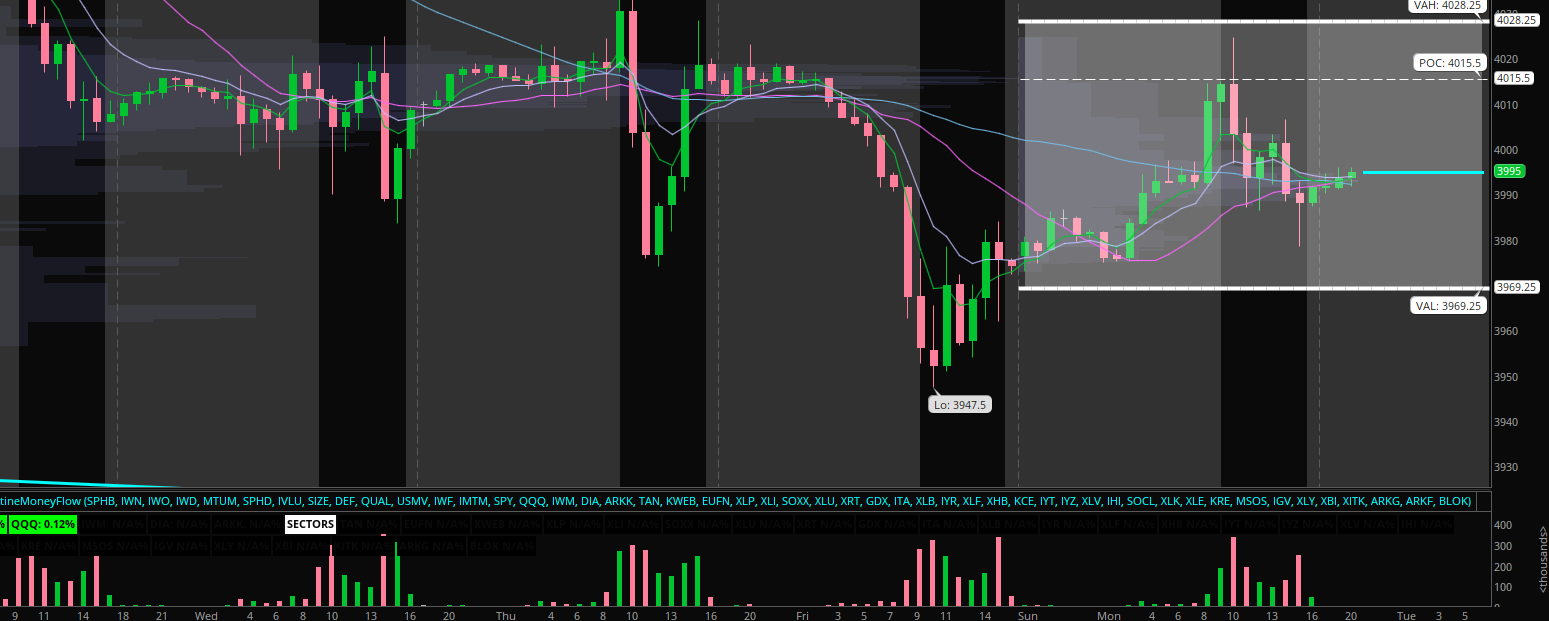
Zooming in to the hourly chart, we’ve been in a choppy, directionless tape since Wednesday 2/22. I’ll be using the weekly value area high ~4,028 and the weekly value area low 3969.25 as pivots. Until we break either of those levels, the risk of getting chopped to pieces is high.
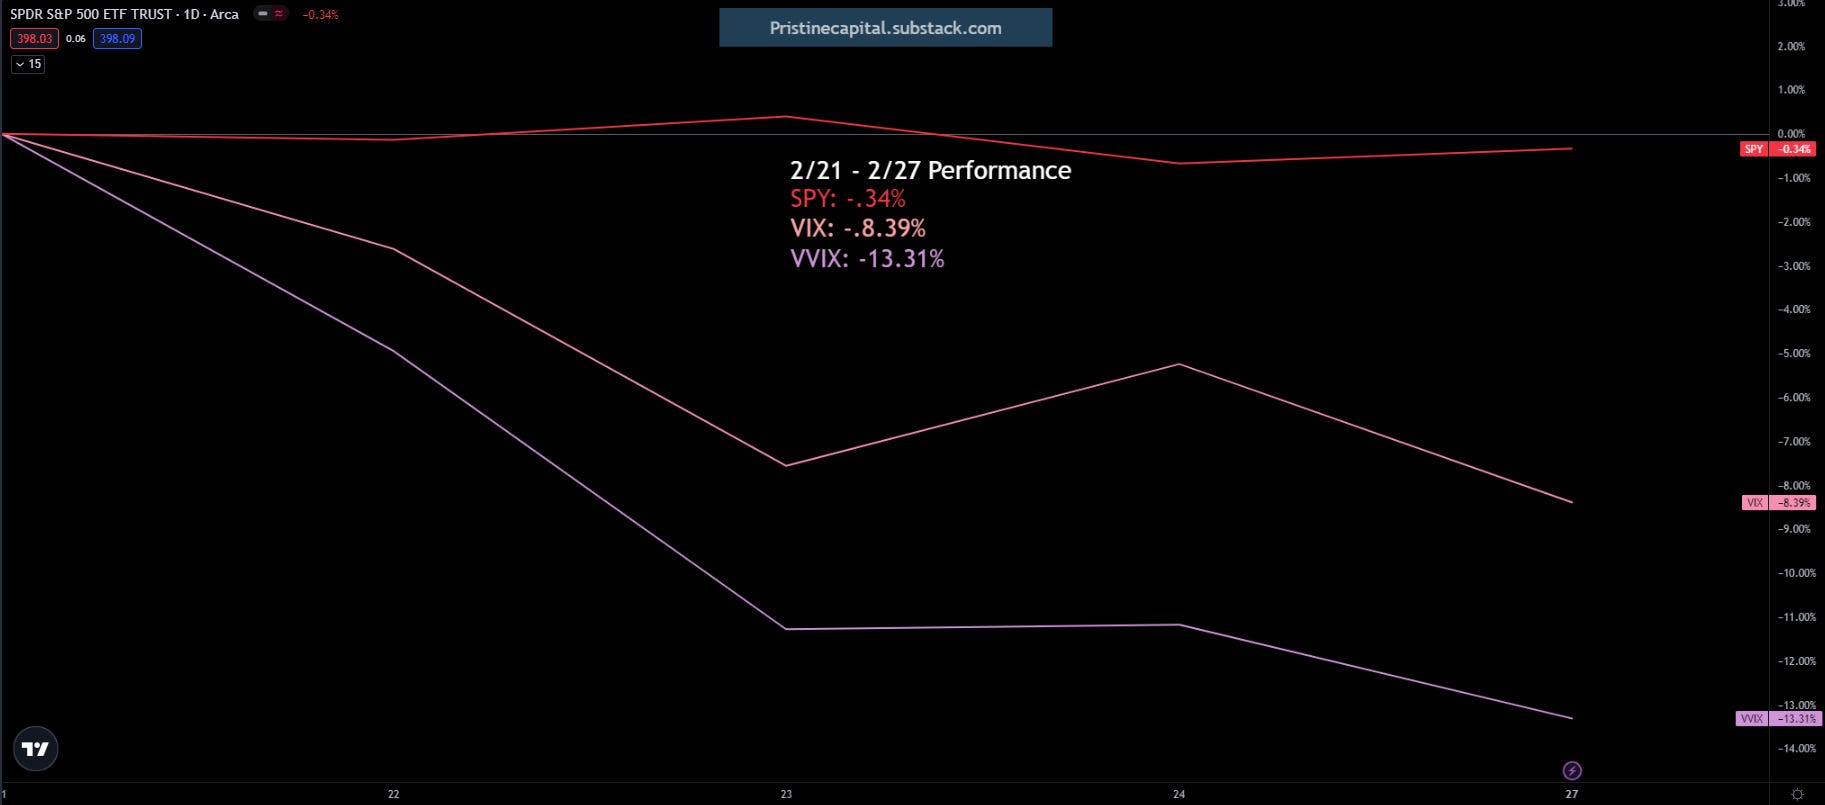
Return on Vol Crush
From Feb 21st till today, the VIX declined meaningfully, but it hasn’t translated to any SPY gains! Volatility declines often fuel equity rallies, so if the market can’t rally when volatility is being crushed, that’s a yellow flag!
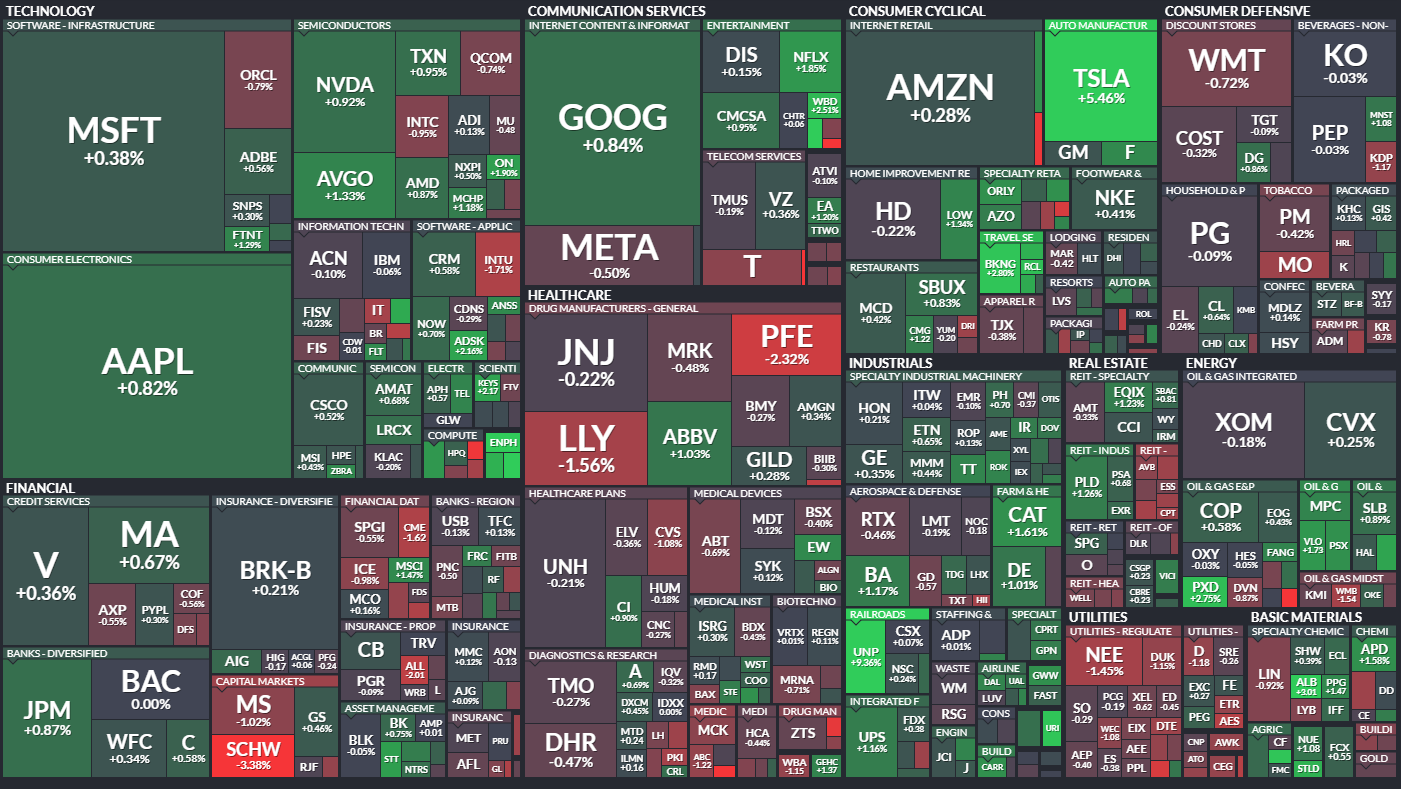
Finviz Heatmap
TSLA carried the market with an impressive 5.46% gain. They have their investor day on March 1st. It would be a shame if….ehh never mind 😎
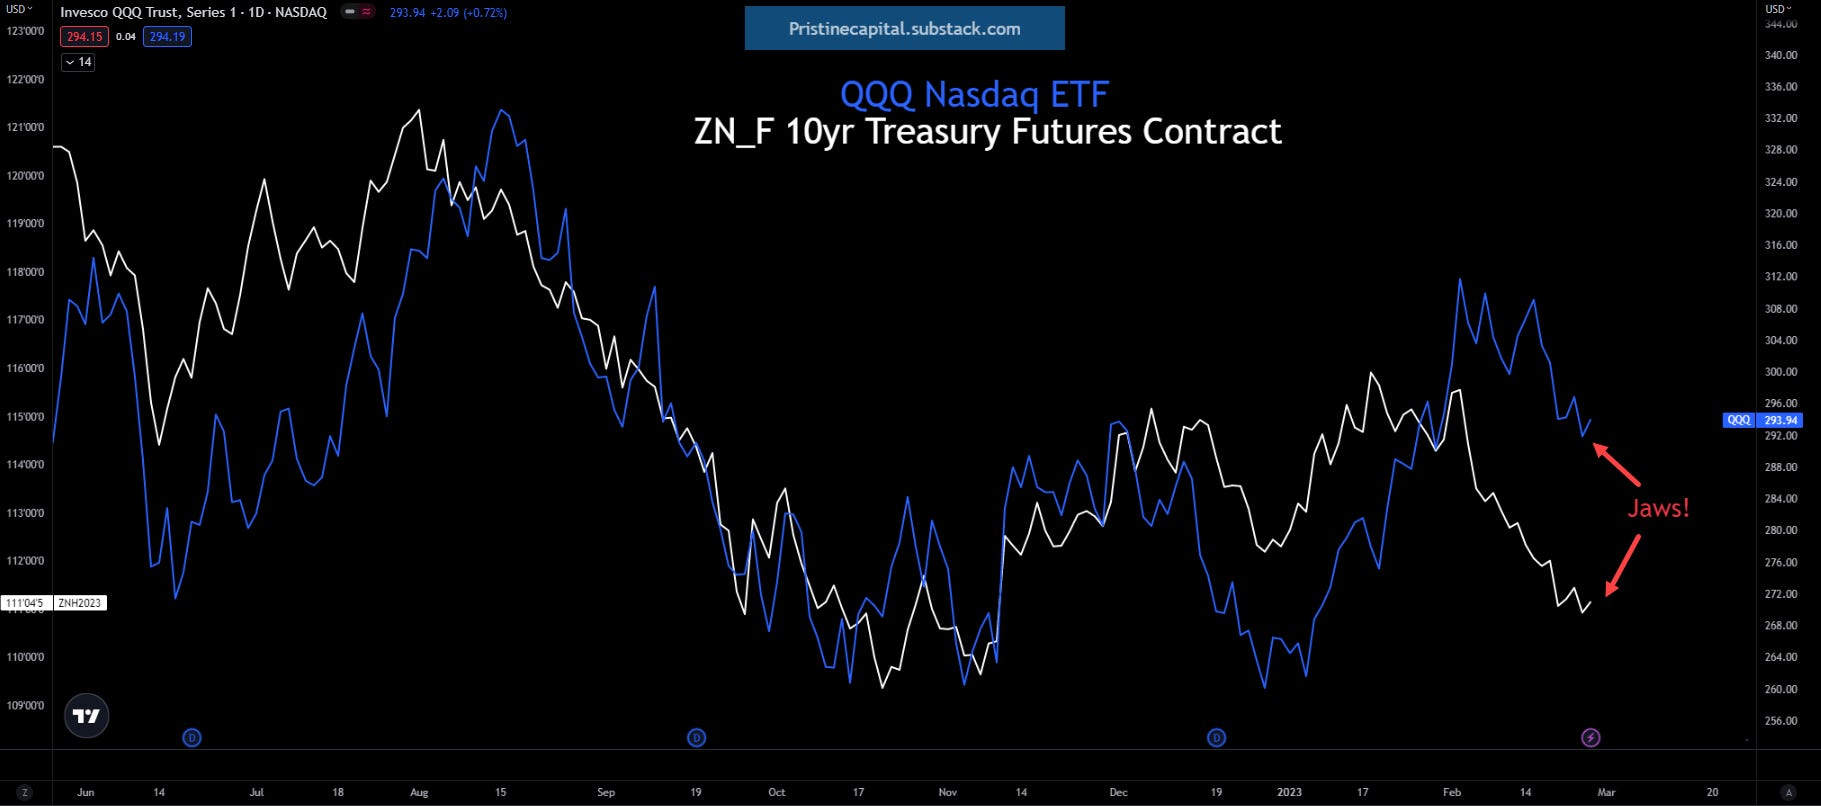
Beware the Jaws
And it would be an even bigger shame if that led to these jaws…ehh never mind
Upgrade your subscription to find out what I believe could be setting up over the next few sessions below.

In the following sections of tonight’s update, I’ll cover my research in preparation for tomorrow’s trading session
✅ Trend Model Update - Our proprietary indicator that informs us on how aggressive/defensive to position in the market
✅Market Strategy - My trading plan
✅ Today’s Trade Blotter and Position Update
✅Daily Watchlist - We scan thousands of stocks and hand-pick the best reward/risk opportunities
