

Pristine Market Analysis & Watchlist 9/21
Bond Yield Breakout!

Team,
Is it shocking that markets sold off to such an extent today? Or shocking that it took so long for this to happen? Let’s take a look under the hood.
-Andrew
Economic Data
For context…last week’s inflation data came out hot, commodity prices have been ripping for months, and Powell signaled that the fed would like to keep interest rates higher for longer. And now today…jobless claims came in lighter than expected. Global risk assets have been resilient for so long against this backdrop, but the dam finally broke today.

FX Market
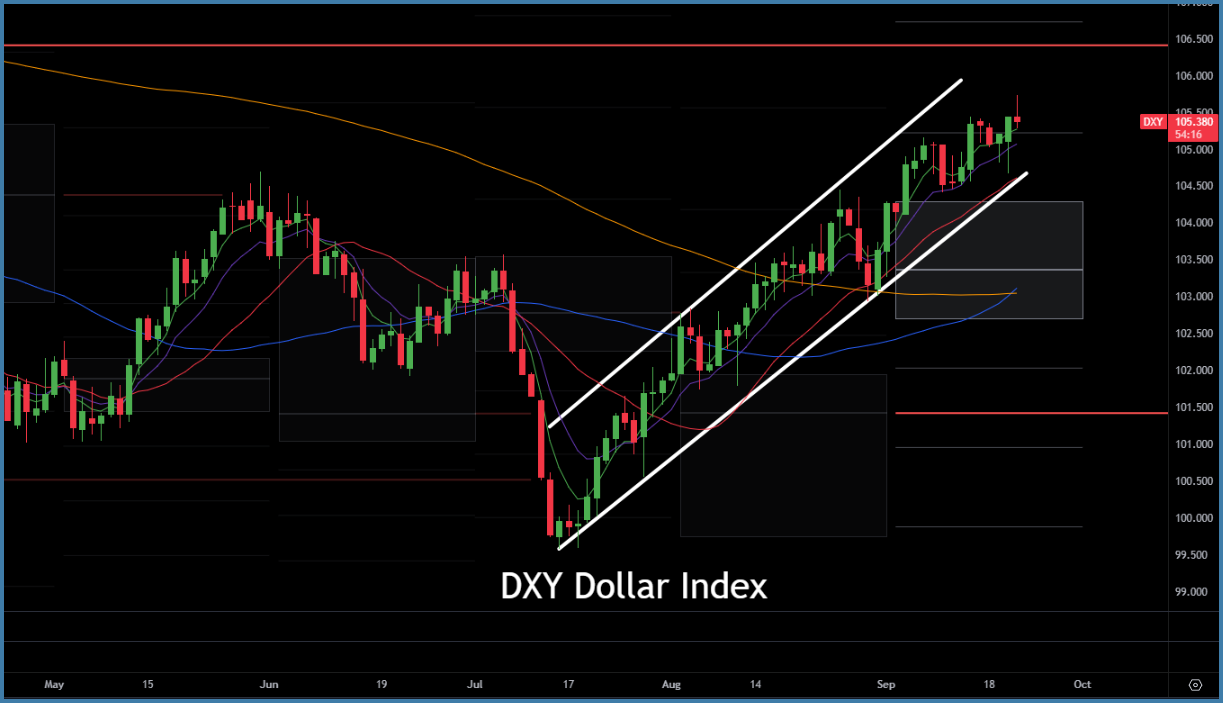
The dollar index remains inside the white bullish trend channel. Remember, there is no raging bull market in risk assets when the dollar index is in such a strong uptrend!
Yield Curve
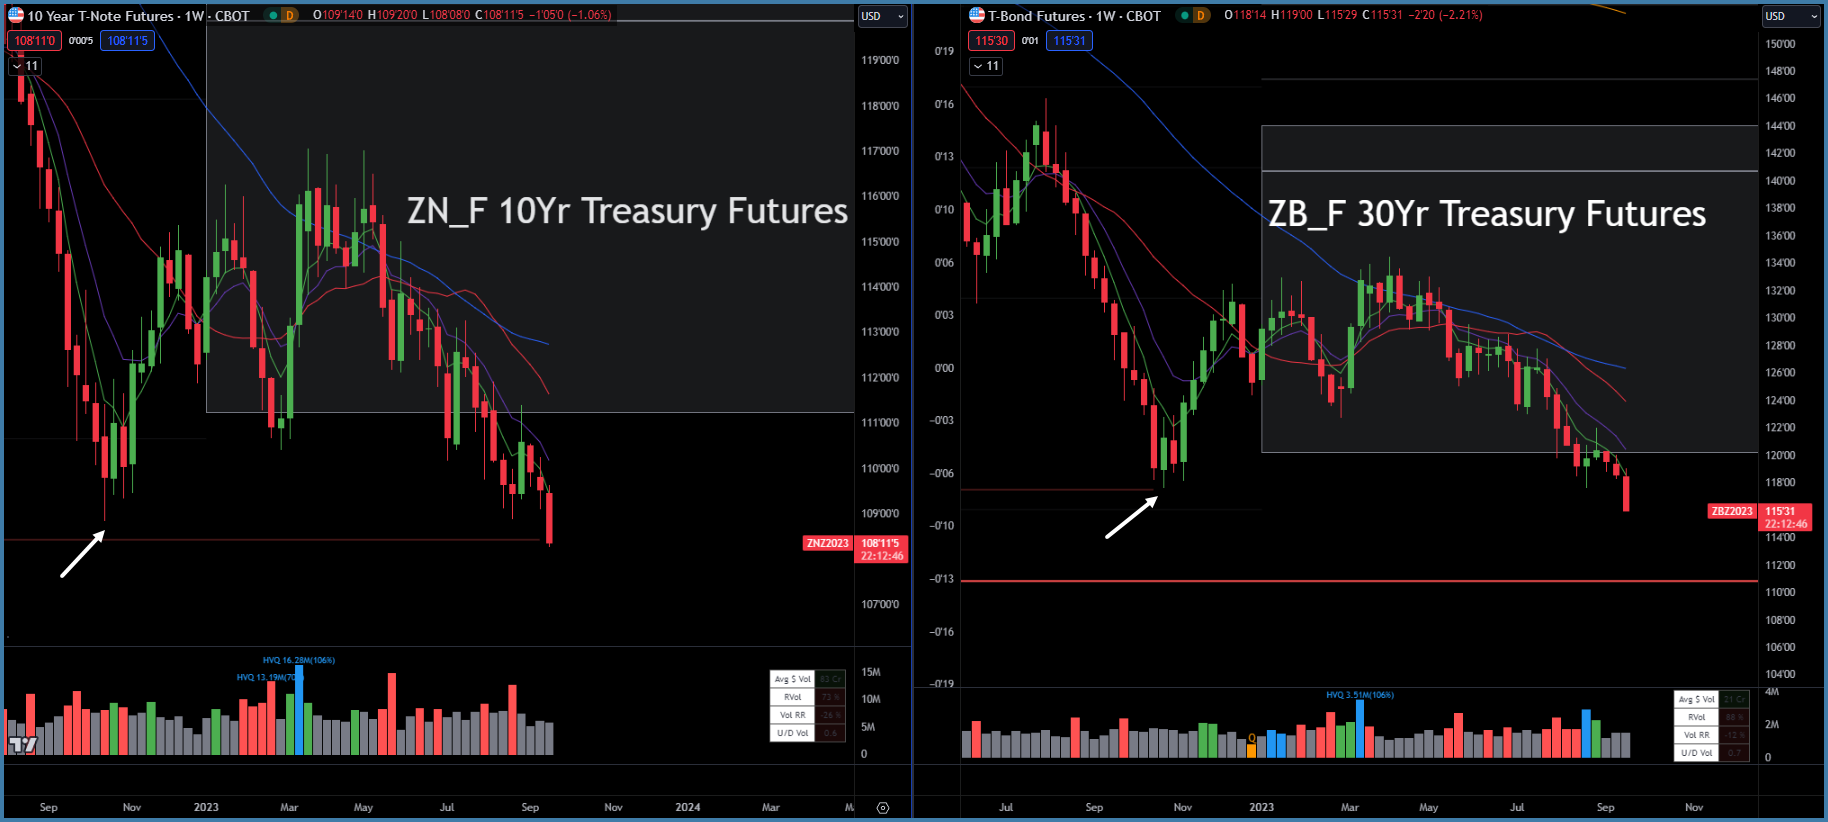
The big story for today was the breakout in bond yields.
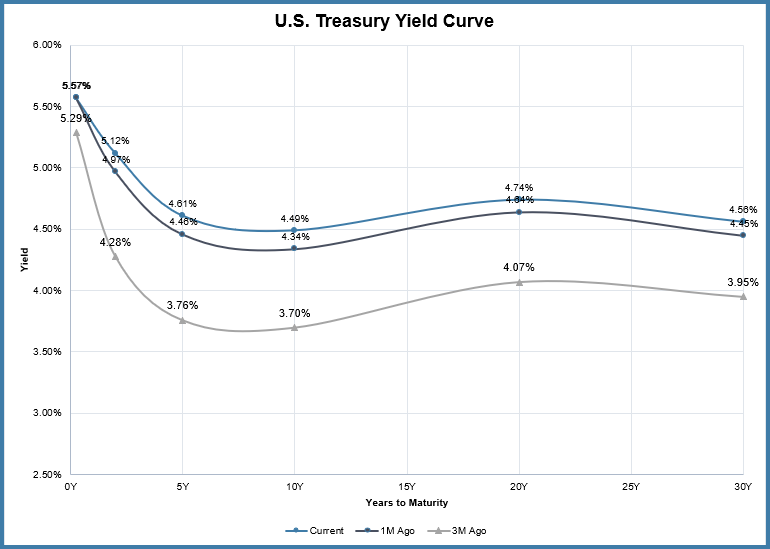
Long-term treasuries cascaded below their Fall ‘22 lows.
Equity Dashboard
Equity indices declined, and the rate-sensitive QQQ and ARKK fell the most.
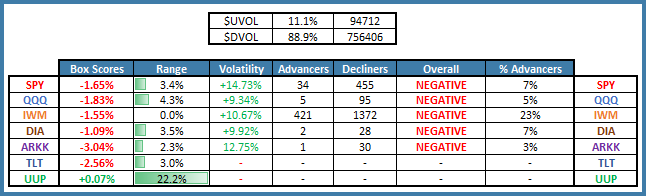
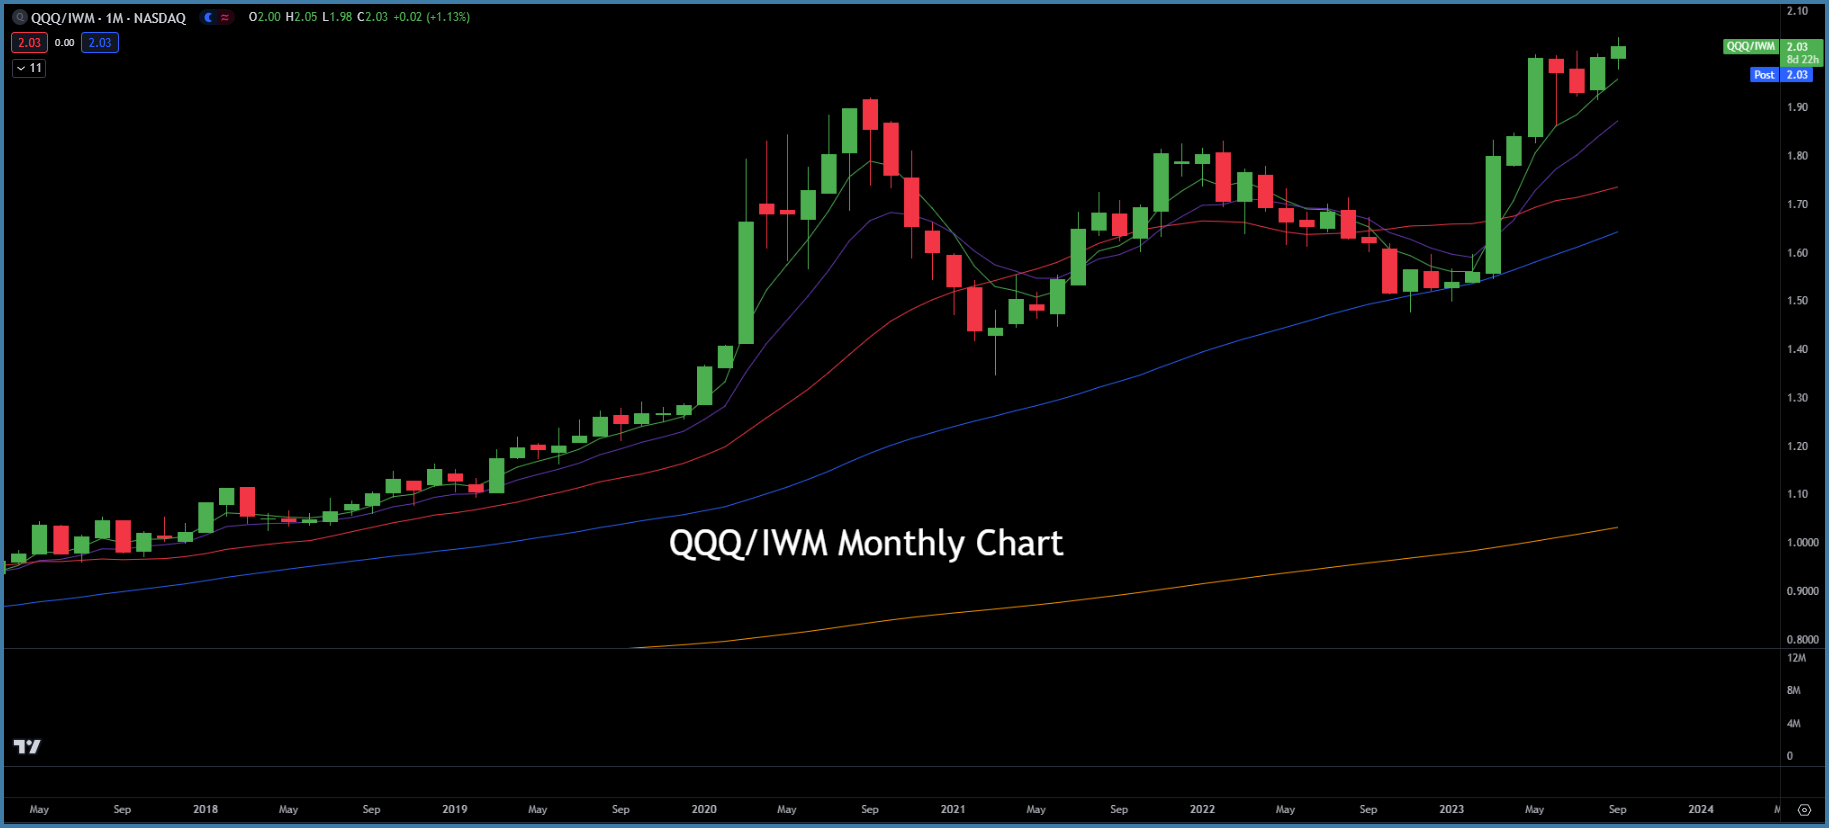
The Nasdaq QQQ outperformance vs IWM Small caps on the higher timeframes is still intact.
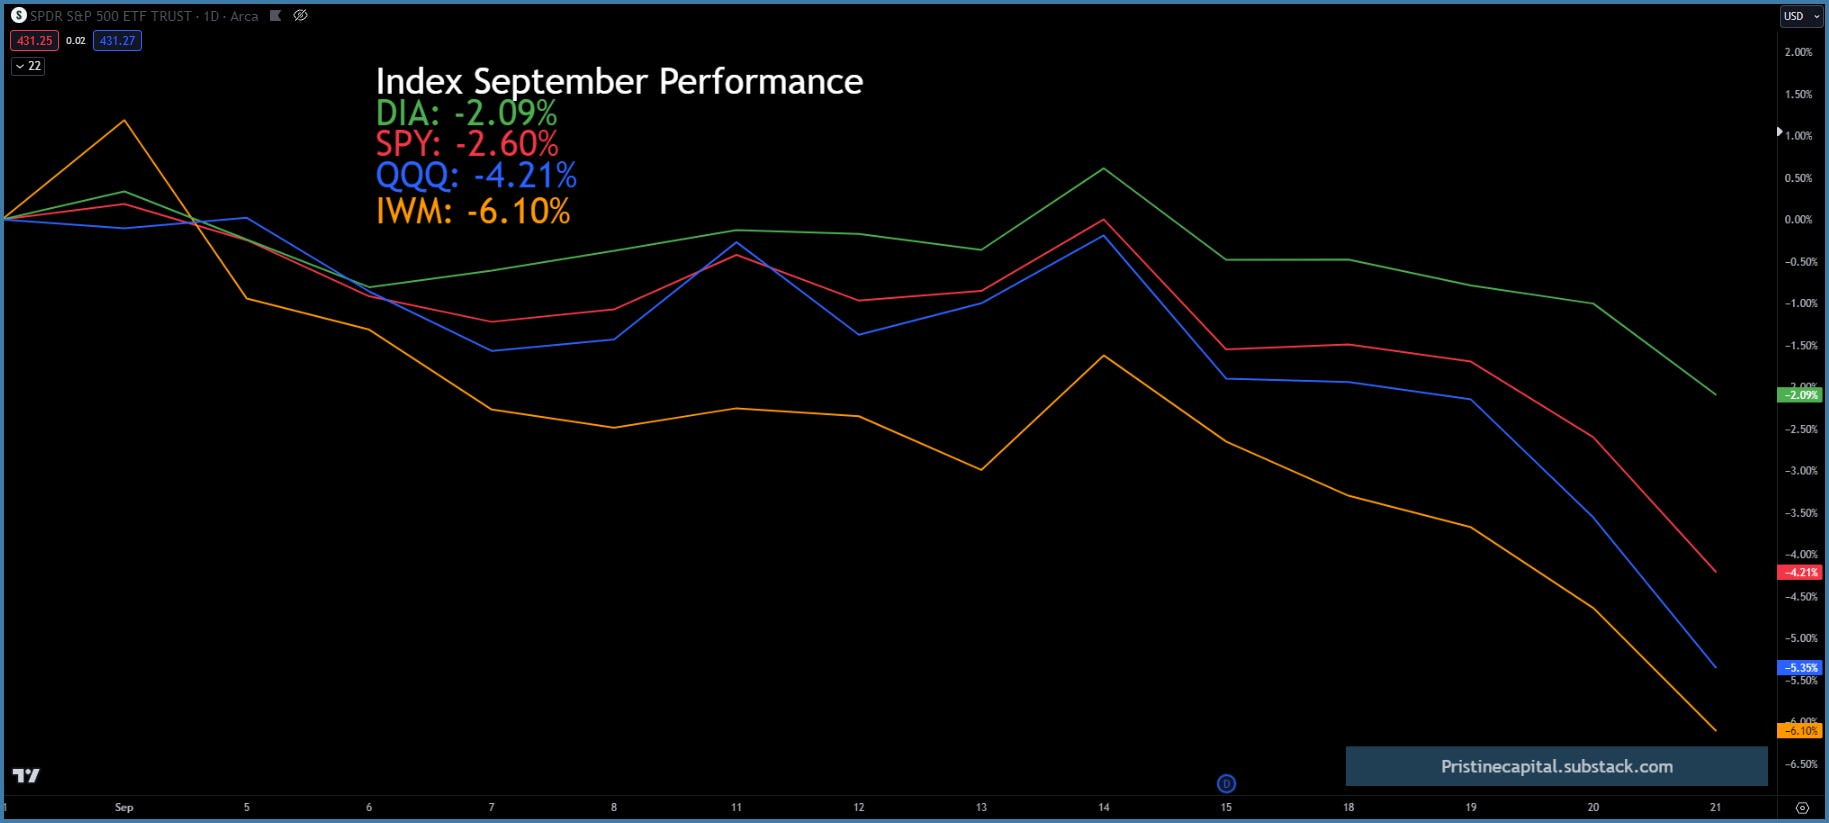
Equity Index MTD September Performance
The indices are in negative territory for the month of September.
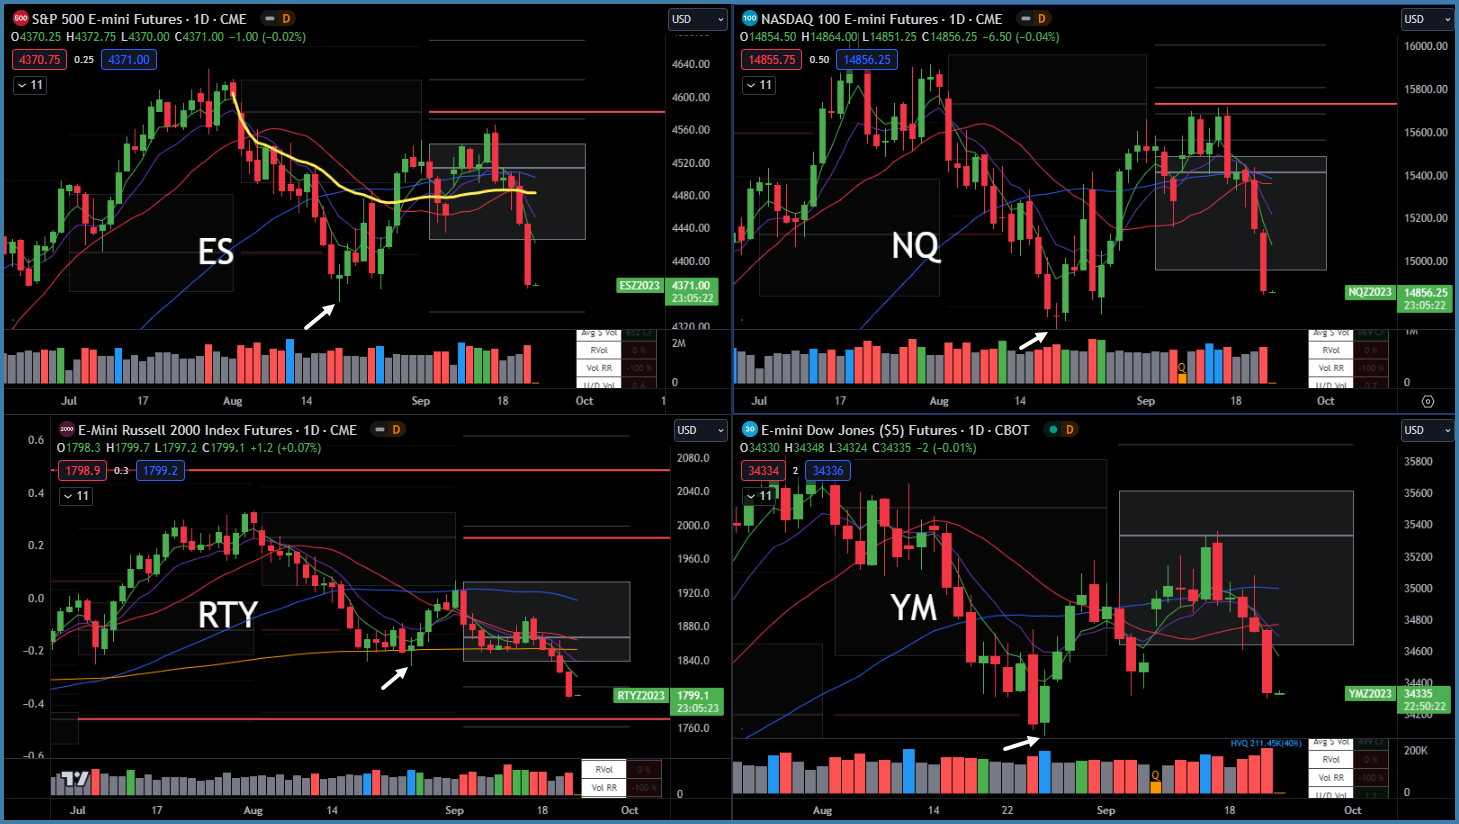
Index Price Cycle Monitor
ES S&P 500 - Below key moving averages and below monthly value area
NQ Nasdaq - Below key moving averages and below monthly value area
RTY Russell 2000 - Below key moving averages and below monthly value area
YM Dow Jones - Below key moving averages and below monthly value area
In the following sections of tonight’s update, I’ll cover my research in preparation for tomorrow’s trading session
✅ Trend Model Update - Our proprietary indicator that informs us on how aggressive/defensive to position in the market
✅Market Strategy - My trading plan
✅ Today’s Trade Blotter and Position Update
✅Daily Watchlist - We scan thousands of stocks and hand-pick the best reward/risk opportunities
