🦾Pristine Breadth Analysis Guide
Everything you need to know about the Pristine Breadth Analysis methodology
Introduction
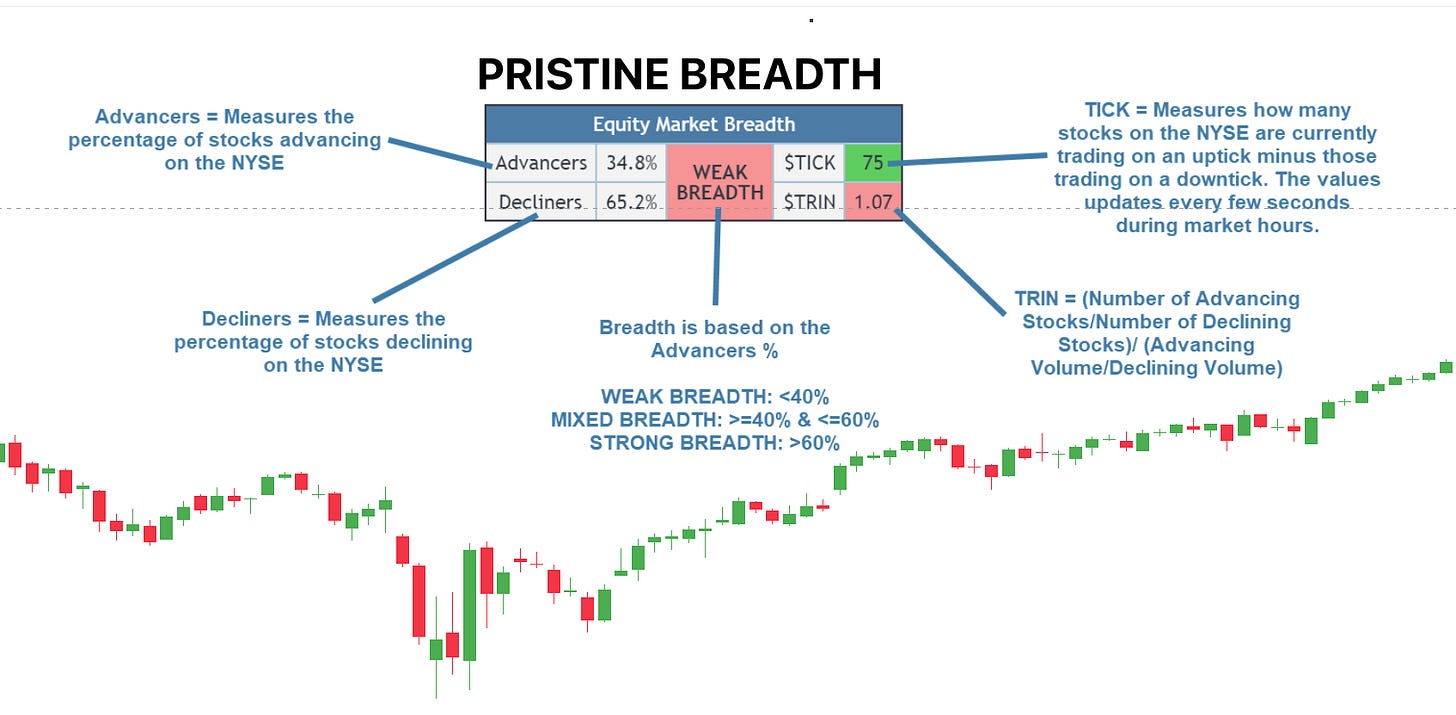
The Pristine Breadth indicator is a tool that organizes and displays key market breadth metrics — Advancers/Decliners, the TRIN index, and the TICK Index —to help traders gauge the overall health and sentiment of the US equity markets.
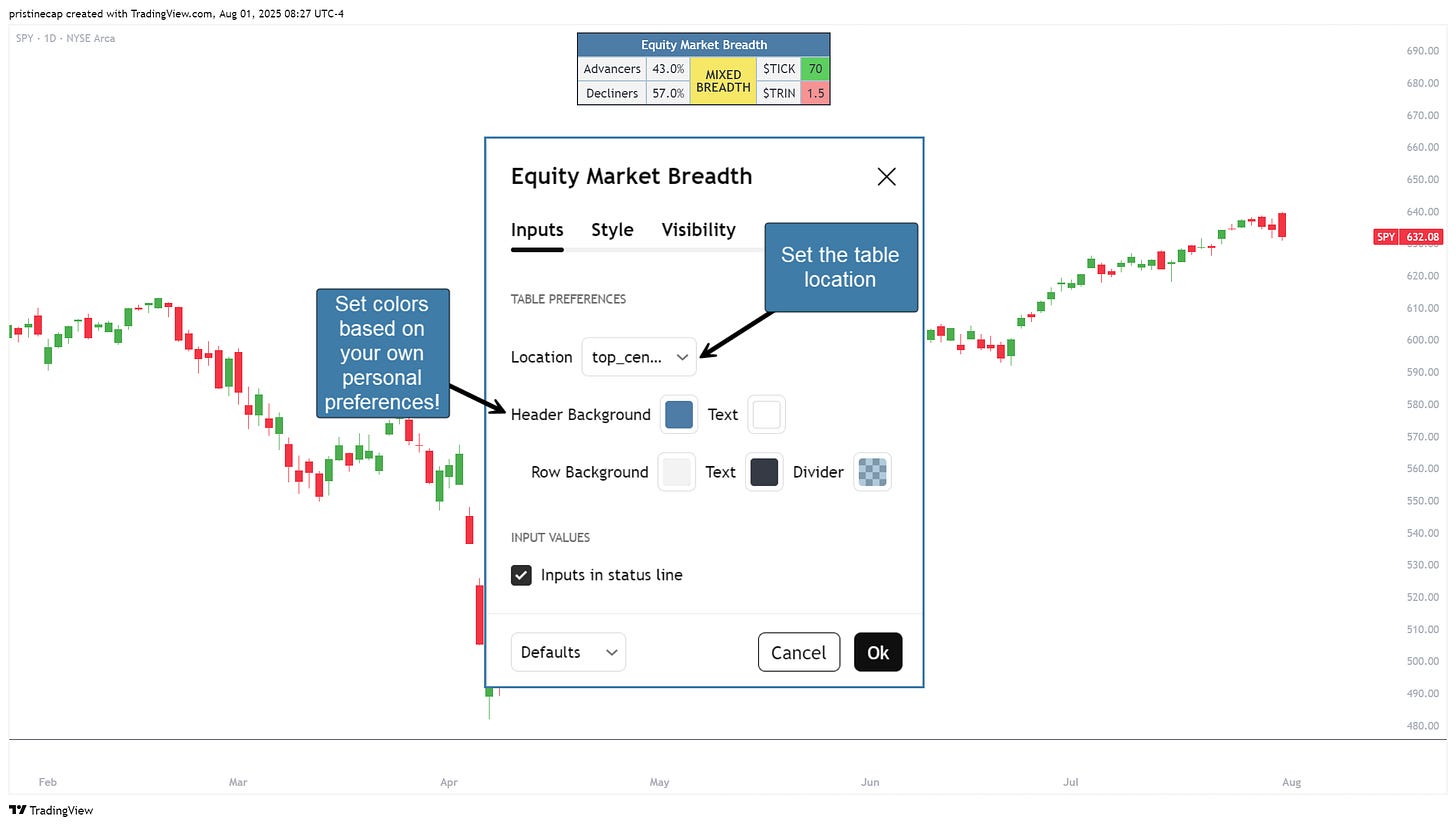
The content for the following educational article was pulled directly from the documentation for our Pristine Breadth TradingView indicator, which is completely FREE to use ⚙️
Without further ado. Let’s dive in!
Table of Contents
▪Case Study - Divergence in S&P 500
Market Breadth
Market breadth is important to track when trading, because most stocks tend to follow the general market trend. When market breadth is strong, the odds of winning when entering long trade setups increases, and vice versa when breadth is weak.
💠 Advancers/Decliners - Measures the percentage of stocks advancing and declining on the NYSE
💠 BREADTH - Based on the Advancers %
▪WEAK BREADTH: < 40%
▪MIXED BREADTH: >= 40% & <= 60%
▪STRONG BREADTH: > 60%
💠 TICK - Refers to the NYSE TICK Index, a market breadth tool used to gauge real-time sentiment on the New York Stock Exchange.
The TICK Index measures how many stocks on the NYSE are currently trading on an uptick minus those trading on a downtick, and its value updates every few seconds during market hours.
What Does TICK.US Show?
▪Positive values (e.g., +800): More NYSE stocks are upticking (trading above their previous price) than downticking. This signals short-term bullish sentiment.
▪Negative values (e.g., -900): More stocks are downticking, suggesting short-term bearish sentiment.
▪Extreme levels (±1,000 or higher): Frequently interpreted as overbought (+1,000) or oversold (-1,000) at that moment. Some traders look for potential reversals when these extremes are reached
💠 TRIN - Represents the Arms Index (TRIN), a popular market breadth and sentiment gauge designed to measure the balance of advancing and declining stocks and their trading volume, primarily for the NYSE.
Calculation:
TRIN = AD Ratio/ AD Volume Ratio
▪AD Ratio = Number of Advancing Stocks/Number of Declining Stocks
▪AD Volume Ratio = Advancing Volume/Declining Volume
TRIN = (Number of Advancing Stocks/Number of Declining Stocks)/ (Advancing Volume/Declining Volume)
This means it compares the ratio of advancing to declining stocks (market breadth) with the ratio of advancing to declining volume, highlighting the weight behind up or down movements.
Interpretation:
▪TRIN below 1.0: Indicates that up-volume is exceeding down-volume on a per-stock basis—bullish, often aligning with rising markets.
▪TRIN above 1.0: Suggests down-volume is heavier than up-volume—bearish, often coinciding with falling markets.
▪Extreme readings: Values well below 0.5 may signal overbought (potential reversal downward); values above 3.0 may indicate oversold (potential reversal upward)
Use Case - Identifying Divergence in S&P 500 Price Action
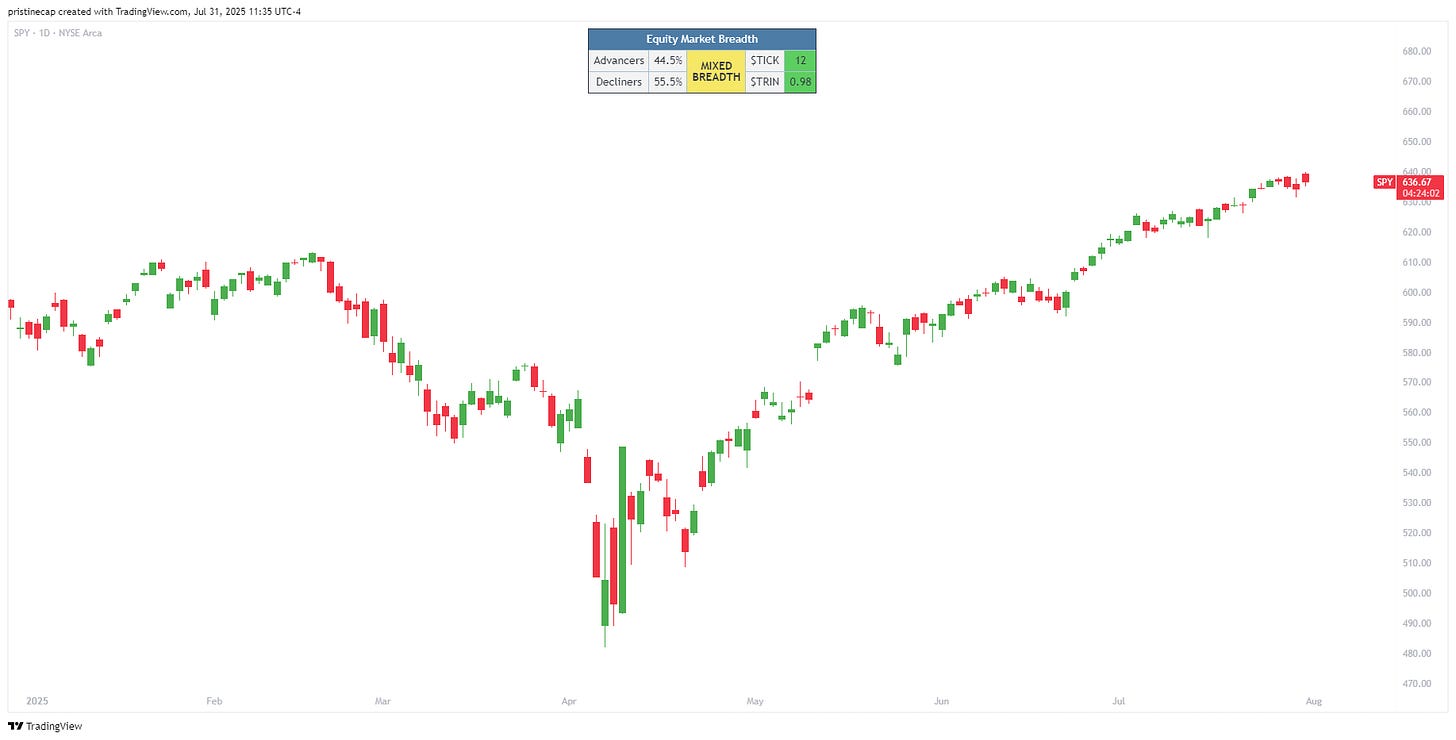
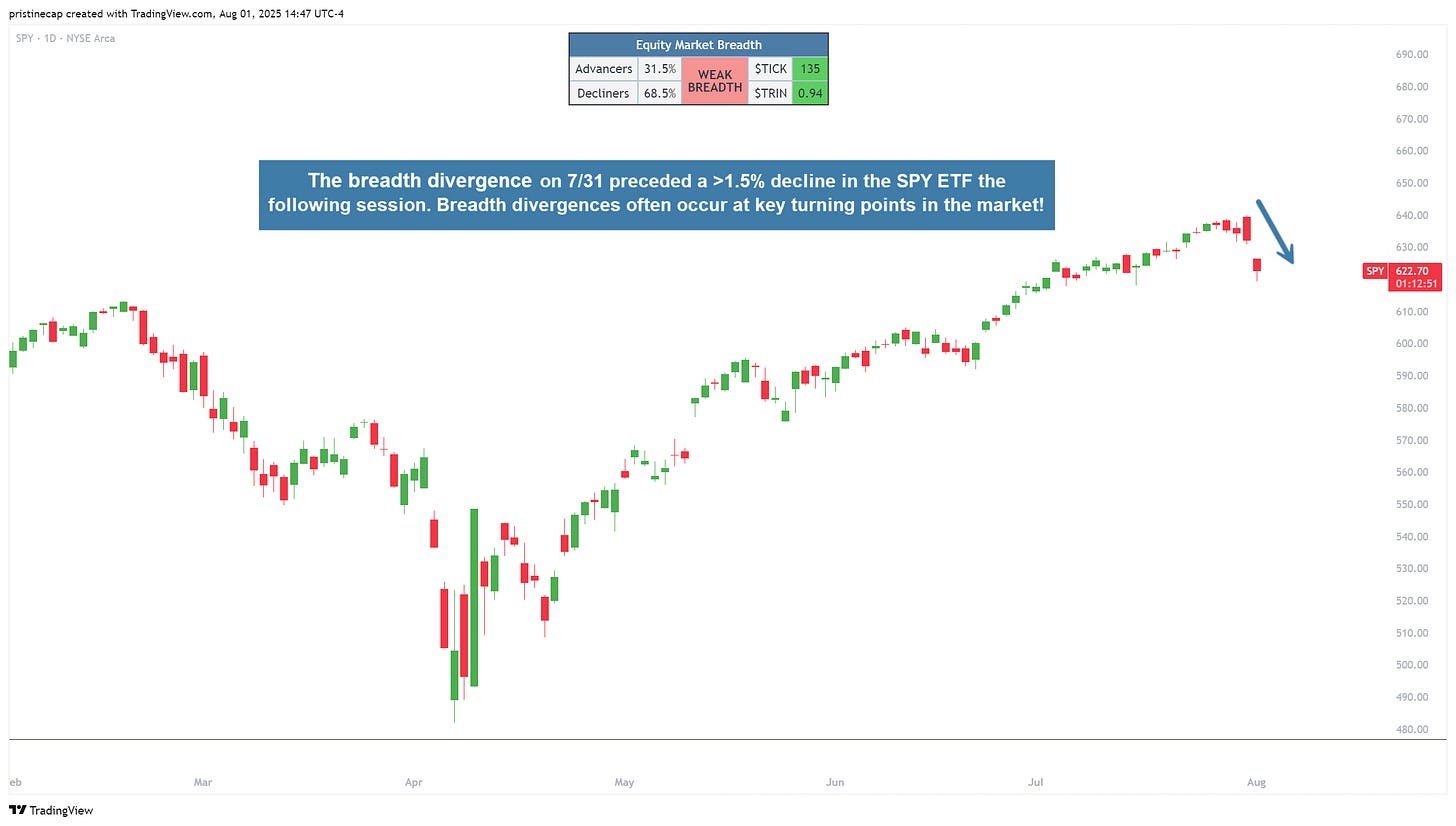
On 7/30/25, META & MSFT reported beat-and-raise quarters in post-market. On the following day 7/31/25, the SPY ETF gapped higher, but breadth did not confirm the advance. Breadth was mixed to start the session, and the SPY ETF lost it's overnight gains as breadth weakened throughout the session:
The breadth divergence on 7/31 preceded a >1.5% decline in the SPY ETF the following session. Breadth divergences often occur at key turning points in the market!


